Market participants often claim that investor sentiment matters for stock returns. This premise was formally studied by Malcolm Baker and Jeffrey Wurgler in their landmark 2006 paper, “Investor Sentiment and the Cross-Section of Stock Returns.” Baker and Wurgler show evidence that supports the common notion investors have held for many years: sentiment matters.
Baker and Wurgler’s sentiment index has been used by many follow-on researchers looking to analyze how sentiment affects their specific research question. However, there hasn’t been much research associated with trying to build a more precise and accurate investment sentiment index.
Until now.
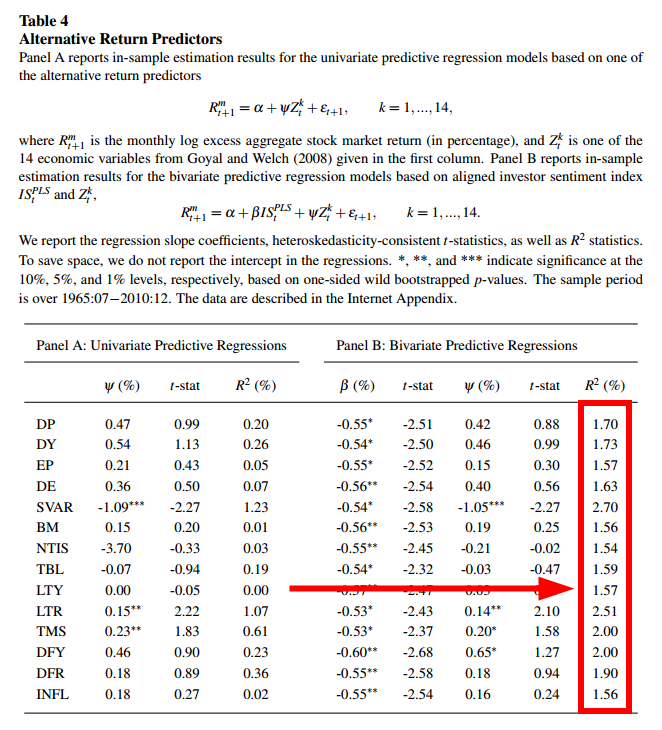
Dashan Huang, Fuwei Jiang, Jun Tu, and Guofu Zhou have a new paper (recently published in the RFS) that introduce an econometric technique that enhances the predictability of sentiment. The table below shows how adding their enhanced sentiment indicator can improve the predictability associated with other variables thought to predict returns.
The results are hypothetical results and are NOT an indicator of future results and do NOT represent returns that any investor actually attained. Indexes are unmanaged, do not reflect management or trading fees, and one cannot invest directly in an index. Additional information regarding the construction of these results is available upon request.
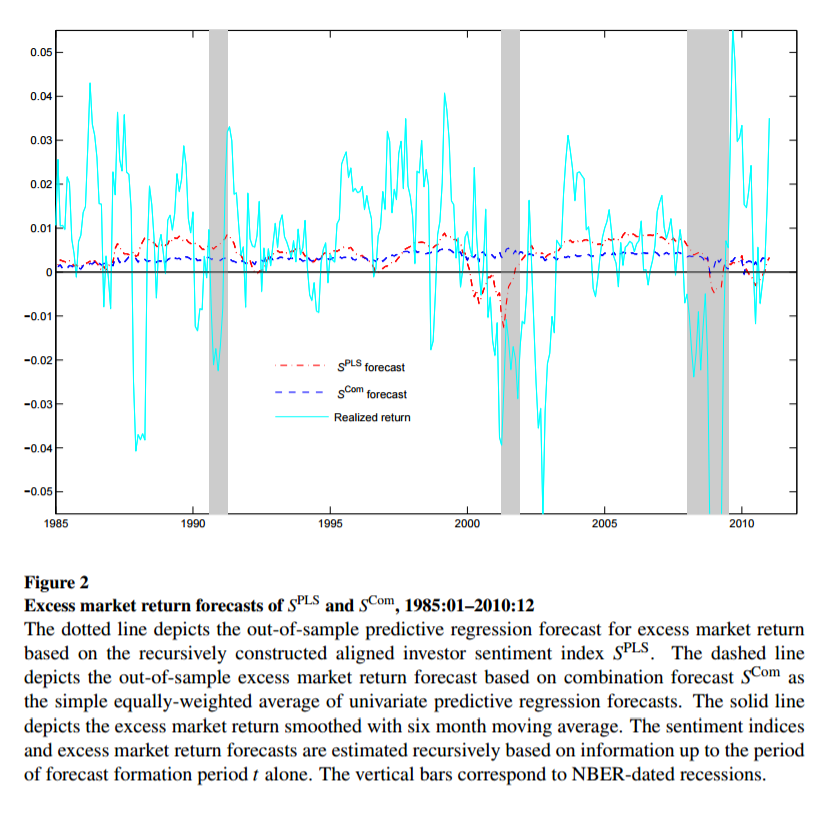
And here is a nice figure highlighting the ability of the enhanced sentiment index to predict excess market returns:
The results are hypothetical results and are NOT an indicator of future results and do NOT represent returns that any investor actually attained. Indexes are unmanaged, do not reflect management or trading fees, and one cannot invest directly in an index. Additional information regarding the construction of these results is available upon request.
Strategy Summary:
The paper begins by creating an aligned investor sentiment index via the partial least squares (PLS) method.
- Data are available from Baker and Wurgler (2006) and span from 1965 through 2010 (546 months).
- The sentiment index is a linear combination of six individual measures: Closed-end fund discount rate, share turnover, number of IPOs, first-day returns of IPOs, dividend premium and equity share in new issues.
Next, the paper forecasts aggregate stock market returns using this new index, both in-sample and out-of-sample. The authors compare their statistical results (β, R-square, t-stats) with the measures in the existing literature.
The findings are as follows:
- Sentiment index exhibits statistically and economically significant predictability. It is important not only cross-sectionally, but also at aggregate market level.
- The in-sample R-square is more than 5 times greater than that in Baker and Wurgler (2006), and out-of-sample R-square is more than 10 times greater.
- Adding sentiment index in conjunction with economic variables can substantially improve the forecasting performance.
- The sentiment index in this paper is more volatile, so it may better capture the short-term variation with future stock return.
- Table 7 examines how the sentiment index predicts different portfolios.
- Stocks that are speculative, small, distressed (high book-to-market ratio) or high growth opportunity (low book-to-market), or past losers are more sensitive to investor sentiment.
Feeling Sentimental Lately?
Investor Sentiment Aligned: A Powerful Predictor of Stock Returns
- Dashan Huang, Fuwei Jiang, Jun Tu, and Guofu Zhou
- A version of the paper can be found here.
- Want a summary of academic papers with alpha? Check out our Academic Research Recap Category!
Abstract:
The widely used Baker and Wurgler (2006) sentiment index is likely to understate the predictive power of investor sentiment because their index is based on the first principal component of six sentiment proxies that may have a common noise component. In this paper, we propose a new sentiment index that is aligned for explaining stock expected returns by eliminating the noise component. We find that the aligned sentiment index has much greater power in predicting the aggregate stock market than the Baker and Wurgler (2006) index: it increases the R-squares by more than five times both in-sample and out-of-sample, and outperforms any of the well recognized macroeconomic variables. Its predictability is both statistically and economically significant. Moreover, the new index improves substantially the forecasting power for the cross-section of stock returns formed on industry, size, value, and momentum. Economically, the driving force of the predictive power of investor sentiment appears stemming from market underreaction to cash flow information
Data Sources:
Baker Wurgler data: http://people.stern.nyu.edu/jwurgler/
New index data: http://apps.olin.wustl.edu/faculty/zhou/SentimentIndices_Dec2014.xls
About the Author: Wesley Gray, PhD
—
Important Disclosures
For informational and educational purposes only and should not be construed as specific investment, accounting, legal, or tax advice. Certain information is deemed to be reliable, but its accuracy and completeness cannot be guaranteed. Third party information may become outdated or otherwise superseded without notice. Neither the Securities and Exchange Commission (SEC) nor any other federal or state agency has approved, determined the accuracy, or confirmed the adequacy of this article.
The views and opinions expressed herein are those of the author and do not necessarily reflect the views of Alpha Architect, its affiliates or its employees. Our full disclosures are available here. Definitions of common statistics used in our analysis are available here (towards the bottom).
Join thousands of other readers and subscribe to our blog.