Filip Lacerda and Pedro Santa-Clara have an interesting paper that investigates the use of dividend growth to predict future returns.
Here is the abstract:
The dividend-price ratio changes over time due to variation in expected returns and in forecasts of dividend growth. We adjust the dividend-price ratio to isolate the fluctuations that are due to variation in expected returns from those that are due to changing forecasts of dividend growth. This adjusted dividend-price ratio is statistically significant in predictive regressions and yields an in-sample R2 of 16.27% and an out-of-sample R2 of 12.35%, which compare with 7.88% and -2.94% for the unadjusted multiple. Structural estimation of our model obtains even higher measures of fit. Our results are robust across subsamples.
One of my students–Heng Qiao–took on a difficult project and replicated the results from the paper.
Here is Heng’s summary of his work:
Out-of-sample R2, which is the ratio between the sum squared error of a “smart” model with that of a simple model (historical average forecasting), helps researchers identify if a model actually improves prediction. This paper develops two new variables dpt and xt , which are the unadjusted dividend-price ratio and the adjusted dividend price ratio, respectively. In the paper, dpt and xt were created through a simple auto-regression, a first-order Taylor Expansion, and a simplification of infinite series. My work was aimed at replicating the paper’s results, and it turns out that there are slight differences between my result and that in the paper. Dealing with the monthly data, my work generated a R2 of 0.53% and R2OOS of 0.8% for dpt, and a R2 of 0.49% and R2OOS of 0.78% for xt. When moved to the annual data, the results are more statistically significant, with R2 of 2.27% and R2OOS of 9.1% for dpt, and R2 of 20.31% and R2OOS of 20.31% for xt.
Below is a copy of the spreadsheet for your learning pleasure.
——————–
predregression.xlsx
——————-
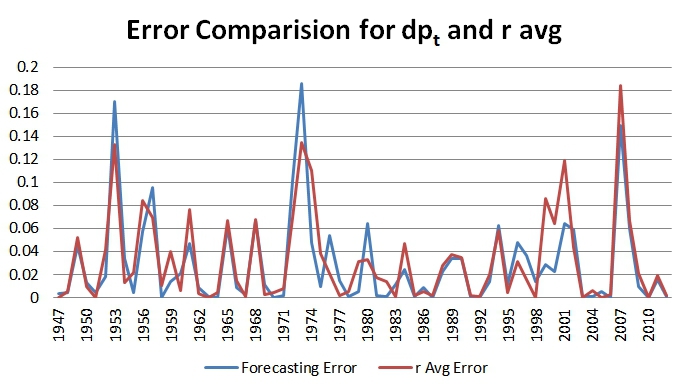
Here is a picture showing the forecast error using the simple dp_t model in the paper (9.1% R2OOS):
Here is a picture showing the forecast error using the more complex x_t model in the paper (20.31% R2OOS):
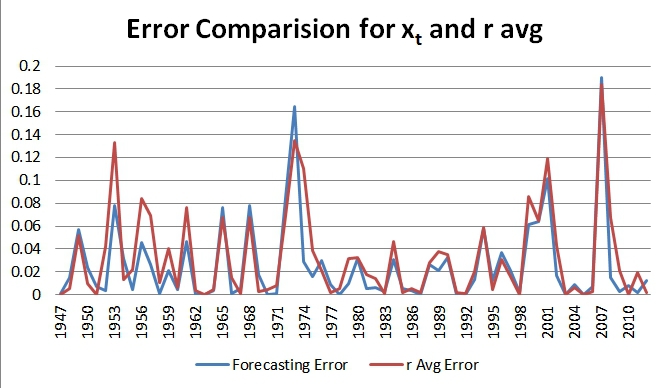
Based on the numbers, the fancy dividend prediction model does enhance the forecasting ability. Visually, as represented in the 2 charts above, there really isn’t much improvement in forecast errors over a simple average return prediction model…
Predicting the stock market is probably the biggest sucker bet out there…
About the Author: Wesley Gray, PhD
—
Important Disclosures
For informational and educational purposes only and should not be construed as specific investment, accounting, legal, or tax advice. Certain information is deemed to be reliable, but its accuracy and completeness cannot be guaranteed. Third party information may become outdated or otherwise superseded without notice. Neither the Securities and Exchange Commission (SEC) nor any other federal or state agency has approved, determined the accuracy, or confirmed the adequacy of this article.
The views and opinions expressed herein are those of the author and do not necessarily reflect the views of Alpha Architect, its affiliates or its employees. Our full disclosures are available here. Definitions of common statistics used in our analysis are available here (towards the bottom).
Join thousands of other readers and subscribe to our blog.