US News laundry lists their top 10 “Value Investing Funds,” or Value Investing ETFs, in their recent article:
The criteria (and weighting) for selecting so-called “Value” ETFs are outlined below:
- Expense Ratio (30%)
- Tracking Error (30%)
- Bid/Ask Ratio (20%)
- Diversification (20%)
Assessing the Criteria
The criteria seem reasonable enough–at the outset. For example, expense ratios are clearly important, and all else equal, lower is better. No qualms here.
But the other criteria don’t make any sense in the context of active investing, especially value-investing!
- Tracking Error — the volatility of the spread in returns between a benchmark and a strategy.
- Minimizing tracking error is akin to maximizing “diworsification.“
- Non-closet indexing funds are penalized?
- Bid/Ask Ratio — measure for how much the ask exceeds the bid; a measure of liquidity
- ETF liquidity is primarily driven by the liquidity of the underlying securities the ETF holds.
- So distress security funds–sometimes referred to as “value” funds–are penalized?
- A phone call to an ETF trading desk that will offer you $50,000,000 liquidity at a 1 penny spread doesn’t matter?
- Diversification — Typically measured by the number of securities held in a portfolio and/or exposures to various sectors/industries.
- Charlie Munger, a preeminent value-investor speaking alongside Warren Buffett at 2004 Berkshire Hathaway Annual Meeting is quoted as saying, “The idea of excessive diversification is madness…almost all good investments will involve relatively low diversification.”
- Nondiversified value portfolios are penalized?
As I’ve pointed out, it is unclear that tracking error, bid/ask ratios, and diversification should be criteria for selecting a value investing fund or etf.
Just how much Value to these Value Funds have?
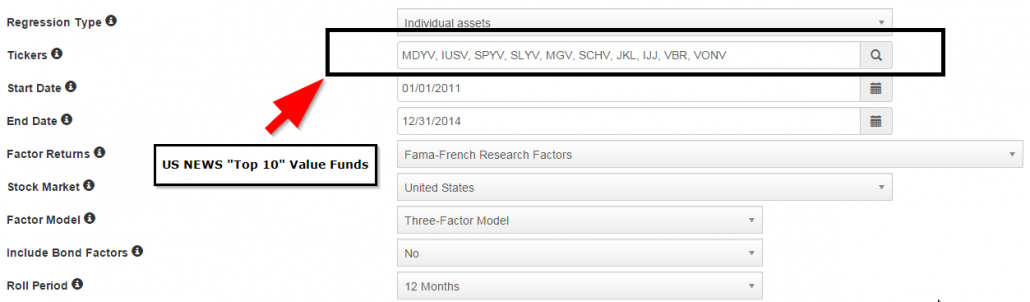
To assess how much “value” is in these value ETFs, we can run a simple factor analysis. To keep things easy we’ll focus on the classic 3-factor Fama-French analysis. This analysis focuses on assessing a strategy’s exposure to the broad market (RM-rf), small-cap stocks (SMB), and value-stocks (HML).
First, a benchmark for value, or HML exposure, from Ken French’s website:
- VAL_10 = Top Decile market-weighted value portfolio (Data)
And the associated factor model analysis. Note the HML factor loading of ~.9 from 1/2011 through 12/2014.
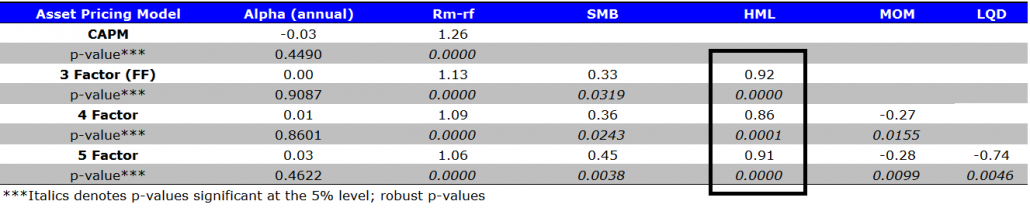
The results are hypothetical results and are NOT an indicator of future results and do NOT represent returns that any investor actually attained. Indexes are unmanaged, do not reflect management or trading fees, and one cannot invest directly in an index. Additional information regarding the construction of these results is available upon request.
I ran some quick stats in PortfolioVisualizer.com to see just how much “value” these so-called value investing etfs identified by US News actually had.
The results are hypothetical results and are NOT an indicator of future results and do NOT represent returns that any investor actually attained. Indexes are unmanaged, do not reflect management or trading fees, and one cannot invest directly in an index. Additional information regarding the construction of these results is available upon request.
The answer?
Not much value to be had. But plenty of closet-indexing.
HML betas are all roughly .2 to .3, a far cry from the basic VAL 10 portfolio.
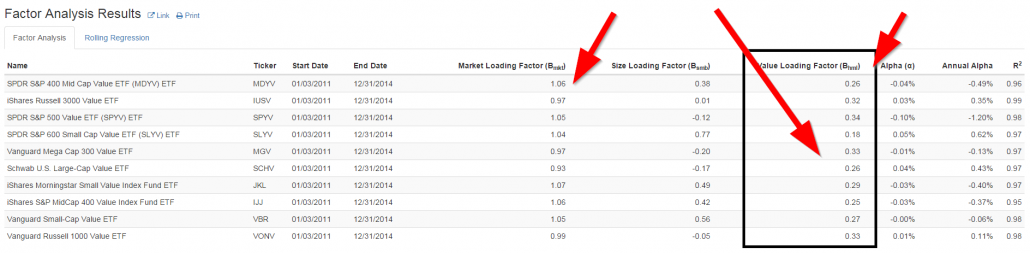
The results are hypothetical results and are NOT an indicator of future results and do NOT represent returns that any investor actually attained. Indexes are unmanaged, do not reflect management or trading fees, and one cannot invest directly in an index. Additional information regarding the construction of these results is available upon request.
Main point?
Avoid US News when assessing which “value funds” are the best fit for your portfolio. (Duh!)
Unless, of course, you value low-tracking error passive market exposures wrapped in a more expensive wrapper entitled “value fund.”

About the Author: Wesley Gray, PhD
—
Important Disclosures
For informational and educational purposes only and should not be construed as specific investment, accounting, legal, or tax advice. Certain information is deemed to be reliable, but its accuracy and completeness cannot be guaranteed. Third party information may become outdated or otherwise superseded without notice. Neither the Securities and Exchange Commission (SEC) nor any other federal or state agency has approved, determined the accuracy, or confirmed the adequacy of this article.
The views and opinions expressed herein are those of the author and do not necessarily reflect the views of Alpha Architect, its affiliates or its employees. Our full disclosures are available here. Definitions of common statistics used in our analysis are available here (towards the bottom).
Join thousands of other readers and subscribe to our blog.