A Value Investing Premium, Everywhere?
A rich body of literature has shown that value investing, or buying stocks that are “cheap” based on a variety of valuation metrics, is robust across different markets. For example, Fama and French (1998) highlighted the value premium across world equity markets. The authors find that value portfolios yield higher average returns than growth portfolios in 12 out of the 13 countries analyzed from 1975 to 1995. The one exception is Italy.
The results are hypothetical results and are NOT an indicator of future results and do NOT represent returns that any investor actually attained. Indexes are unmanaged, do not reflect management or trading fees, and one cannot invest directly in an index. Additional information regarding the construction of these results is available upon request.
Fama and French (1998) also look at emerging markets and find value premiums are pervasive — in 12 out of 16 emerging markets. There are also research pieces from Chan, Hamao and Lakonishok (1991), who test value in the Japanese market; Athanassakos (2010), who tests the value premium in the Canadian market; and Arshanapalli, Coggin and Doukas (1998), who test over North America, Europe, and the Pacific-rim.
These studies represent some prominent examples, but the list goes on and on…
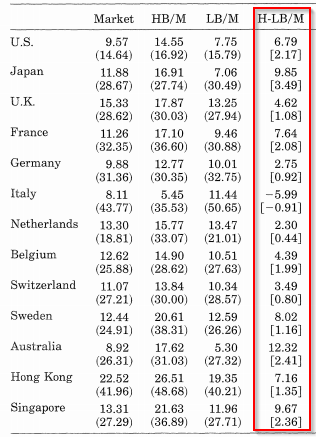
A more recent entrant in the value investing research space is a paper by Asness and Frazzni (2013), who propose a more timely method to calculate the market price component of the book-to-market ratio. Specifically, the authors construct value portfolios using a more timely B/M ratio calculation for the U.S. and 19 international equity markets and find that the value premium is stronger than previously documented.
Digging into the Data…
We went ahead and snagged some monthly data on global value returns and generated some updated charts related to the value premium.
Click here to download the data. AQR has made many of their factors available via their website.
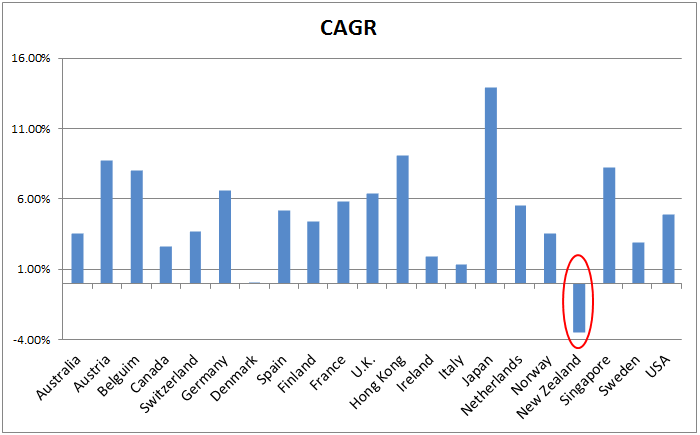
The sample starts from 7/1990 to 2/2015 and we calculate the Compound Annual Growth Rate (CAGR), Max Drawdown, and Sharpe Ratios for long/short value portfolios. Note: We exclude Greece, Israel and Portugal, which have short data periods that do not extend back to 1990.
CAGR
The size-adjusted long-cheap/short-expensive portfolios generate positive returns in 20 out of 21 countries (the exception is New Zealand). The top 5 value premiums exist in Japan, Hong Kong, Austria, Singapore, and Belguim. The lowest 5 value premiums exist in Denmark, Italy, Ireland, Canada and Sweden.
The results are hypothetical results and are NOT an indicator of future results and do NOT represent returns that any investor actually attained. Indexes are unmanaged, do not reflect management or trading fees, and one cannot invest directly in an index. Additional information regarding the construction of these results is available upon request.
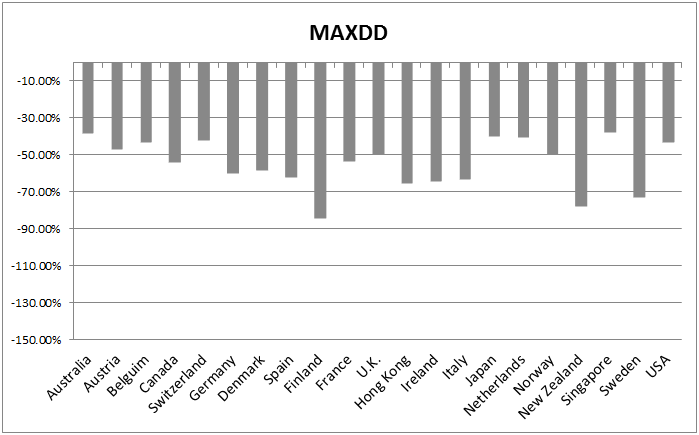
Max Drawdown
The max drawdown charts show that value investing is not a short-term arbitrage opportunity. Value can–and will–go down significantly in value alongside the general market.
The results are hypothetical results and are NOT an indicator of future results and do NOT represent returns that any investor actually attained. Indexes are unmanaged, do not reflect management or trading fees, and one cannot invest directly in an index. Additional information regarding the construction of these results is available upon request.
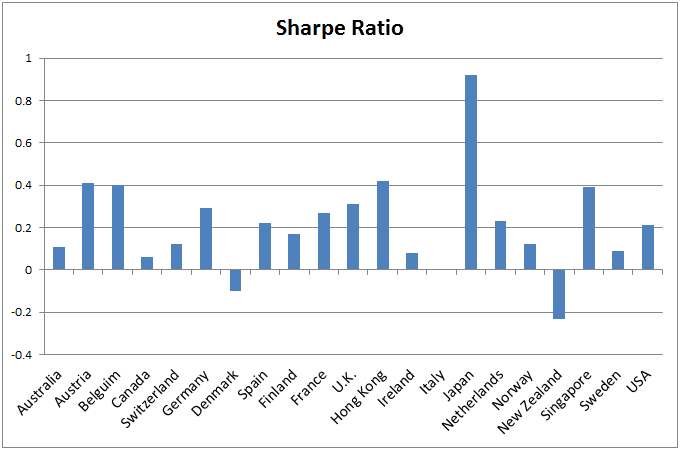
Sharpe Ratio
The results are hypothetical results and are NOT an indicator of future results and do NOT represent returns that any investor actually attained. Indexes are unmanaged, do not reflect management or trading fees, and one cannot invest directly in an index. Additional information regarding the construction of these results is available upon request.
Across 21 countries, Japan value premiums have the highest Sharpe ratio, while New Zealand and Denmark has negative Sharpe ratios.
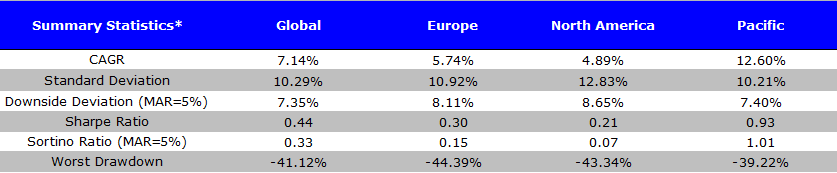
Statistics by Regions
Here we compare the value investing premiums by region. The Pacific region has been the strongest, led by Japan.
The results are hypothetical results and are NOT an indicator of future results and do NOT represent returns that any investor actually attained. Indexes are unmanaged, do not reflect management or trading fees, and one cannot invest directly in an index. Additional information regarding the construction of these results is available upon request.
Value investing across the globe has been a good bet, historically. We encourage you to dig into the data and share your insights.

About the Author: Wesley Gray, PhD
—
Important Disclosures
For informational and educational purposes only and should not be construed as specific investment, accounting, legal, or tax advice. Certain information is deemed to be reliable, but its accuracy and completeness cannot be guaranteed. Third party information may become outdated or otherwise superseded without notice. Neither the Securities and Exchange Commission (SEC) nor any other federal or state agency has approved, determined the accuracy, or confirmed the adequacy of this article.
The views and opinions expressed herein are those of the author and do not necessarily reflect the views of Alpha Architect, its affiliates or its employees. Our full disclosures are available here. Definitions of common statistics used in our analysis are available here (towards the bottom).
Join thousands of other readers and subscribe to our blog.