It seems that a new exchange-traded fund is born every minute. Want Peruvian commodity exposure? There’s an ETF for that. Want German Bund exposure with forex hedging? There’s an ETF for that one, too. Do you like Kevin O’Leary from “Shark Tank”? If so you’re in luck, because he launched five ETFs in 2015.
Name a theme, idea, or an investment style, and odds are, someone, somewhere has manufactured some kind of ETF to fit your needs. Sometimes the blizzard of ETFs feel little like spaghetti being thrown up against the wall to see what will stick.
So how can an investor sift through the myriad of choices and invest in the right ETFs? Before venturing into that niche ETF, make sure you know the distinction of the three core ETF options:
- Index ETFs: The Ford of the ETF world. It gets you from A to B. Cheap and no frills. Index ETFs consist of a large number (hundreds) of stocks that match a broad market index. Think Standard and Poor’s 500 or the Russell 2000. Index ETFs also have low operating and research expenses, which enable them to charge low expense ratios (typically 0.25% or less). Most importantly, however, is that Index ETFs don’t try to beat the market because they try to mirror the market itself (low conviction).
- Closet-Index or “Smart Beta” ETFs: The Lincoln Sedan. Sleek and black, with a few fancy bells and whistles, but it is still a Ford underneath the hood. Most smart-beta ETFs are similar to index ETFs. They tend to hold large, diversified portfolios that track fairly closely to a market index. However, Smart beta includes an element of “secret sauce” which tilts the portfolio toward some investing style that the fund prefers (e.g., value stocks or momentum stocks). Smart-beta ETFs typically charge a higher fee than their index cousins (0.25% to 0.50%), but because they only exercise modest conviction toward a particular style, their ability to win or lose relative to the market is limited.
- Active ETFs: The Tesla of the group. Instantaneous acceleration, zero emissions – this is a different animal entirely. Active ETFs bet on a particular investment style and concentrate their holdings to outperform the market (e.g., a 30 stock value ETF). Active ETFs are “going for it” and tend to have performance that deviates wildly from an index because the Active ETF is emphatically not trying to mirror an index. Active ETFs tend to have higher expense ratios (0.75% to 1%), but since their strategies are concentrated, they have the ability to substantially win or lose relative to a broad market index.
So which vehicle do we choose for our journey? A plain vanilla index ETF? Test the waters with a smart-beta strategy? Or do we go all in with an active ETF?
If you believe stock prices are always efficient, you shouldn’t pay high fees for active strategies–buy Index ETFs. But if you believe market prices are sometimes flawed, you might want to explore active strategies. However, an investor needs to carefully consider how much she may pay per unit of “active” management. Do we buy the Tesla (active ETF) or do we opt for a Lincoln sedan (smart beta)?
Consider a smart-beta value ETF that charges 0.50% and holds 250 value stocks and an active ETF that charges 1% and holds 50 value stocks. For simplicity, let’s assume the smart beta and the active ETF follow the same strategy, and the only difference is concentration. Let’s also say value strategies have similar risk to the broad market. Which value ETF should we buy?(1)
The naïve answer is “buy the cheapest,” but that answer is incorrect. The smart-beta ETF and the active ETF have very different return profiles and fees. You must look at both fees as well as expected returns to make the right call. For example, if the 50-stock value portfolio generates a 1.5% average expected return above the market (0.50% after fees), and a 250-stock value portfolio generates a 0.5% average expected return above the market (0.00% after fees), the active ETF is a much better value despite being twice the cost.
Digging deeper into the true cost of smart beta ETFs
The simple example above highlights that the headline price on an ETF can be misleading because an ETF buyer is always implicitly buying a passive piece and an active piece when purchasing a non-passive index fund. If an ETF holds, say, 300 or 400 stocks, it might have a higher passive component. Meanwhile, if it holds only 50 or 100 stocks, it might have a relatively higher active component. In any given case or blend, don’t want to pay much for the passive piece and we want to minimize our expense for the active piece. But how can an investor get their arms around this complex decision? How can you quantify what is active and what is passive?
In the analysis that follows we shed some light on this problem using a financial engineering framework. As an example, we show that buying a Smart Beta “value” ETF at 45bps is equivalent to paying 5bps for a generic passive exposure and 138.33 bps for the active value exposure!
That 138 bps is pretty expensive, even for a mutual fund. But how many investors are aware that “low-cost” smart beta products might therefore be implicitly charging fees that are equivalent to many highly active mutual fund fees?
Stepping back: What exactly is Smart beta?
We define smart beta to be any strategy that holds a large well-diversified portfolio (i.e., 100+ securities) that tilts away from a standard market-cap weighted passive index based on an identified “factor.” Smart beta portfolios are typically characterized as follows:
- Large portfolio holdings (100+ stocks)
- Tilted towards a factor (e.g., value, growth, momentum, volatility, size, etc.)
- So-called “reasonable” fees (30-75bps)
- Low- to mid-level tracking error (volatility relative to a benchmark)
Smart beta is becoming more and more ubiquitous in the marketplace, but the name is a misnomer. As Gene Fama states:
Multifactor models have factors in addition to the market factor, and the additional factors have their own regression slopes, which can be interpreted as additional betas. The additional betas are not alternative or smart.
To address the poor naming convention, Morningstar is leading an effort to rebrand smart beta as “strategic” beta, and we commend the effort. At a recent Morningstar conference, one participant observed, “the implication is it makes indexing sound dumb.”
However, as this post highlights, regardless of the naming convention, smart beta is often a redundant and overpriced way to exploit investment factors.
- Smart beta is often redundant because these strategies can be replicated via allocations to passive products and high-conviction active strategies trading on the same factor.
- Smart beta is often overpriced because a financially engineered smart beta exposure is typically cheaper than the underlying smart beta product offered in the marketplace.
As a point of reference, we aren’t the first to question smart beta: Bill Sharpe:
Smart Beta makes me definitionally sick.
We’ve even posed the question: Is Smart Beta Bullsh&%? But we are not ready to kill an idea that has attracted 100’s of billions of dollars in the marketplace. Consumers have voted with their feet. That said, our basic empirical analysis seems to suggest that consumers may not be fully informed when making the decision to purchase a smart beta investment product. As the basic analysis below shows, SMART BETA IS MORE EXPENSIVE THAN YOU THINK.
Some background
Before providing analysis, we want to be clear on how we define various terms. Here are a few concepts that are central to understanding the investments industry:
- Alpha: Formally, alpha represents the intercept estimate from a regression of an investment strategy against various risk-factors. In practice, “alpha,” is a blanket term for performance above and beyond a benchmark, controlling for various risk exposures unique to a strategy.
- Tracking Error: Tracking error is defined as the standard deviation of the difference between a strategy’s returns and a benchmark’s returns. In other words, tracking error is a measure of how closely a portfolio follows, or “tracks,” an index.
- Index/Passive: By construction, index/passive portfolios are designed to have no tracking error or alpha. A good example of an index strategy is the Vanguard S&P 500 Index Fund. This fund does not attempt to add alpha, but seeks to match the performance of the S&P 500 index with minimal tracking error.
- Active Share 1: This measure quantifies the extent to which, or how “actively,” a manager reshapes a portfolio with respect to a benchmark. One can think of this as a measure of conviction, or dedication to being different from an index. Active Share is a formal calculation developed by Cremers and Petajisto (2009), but a good proxy is simply the number of securities in a portfolio. For example, a manager that holds 50 equally-weighted stocks will likely have a much higher Active Share than a manager that holds 500 market-weighted stocks. There are debates on active share’s association with future performance, which we discuss here.
We see the world of investment products falling into three general buckets: index, closet index, and active.
- Index Products: Index (“Passive”) products offer no alpha, no tracking error, and no Active Share, or conviction. These funds, typified by Vanguard’s products, have a high number of securities, low expense ratios, and low marketing costs.
- “Closet Index” Products: Closet Index products, sometimes referred to as “Smart Beta,” offer little to no alpha, little to no tracking error, and little Active Share, or conviction. These funds typically have a high number of securities, low to mid-level expense ratios, and high marketing costs.
- Active Products: Active products, often delivered via mutual fund or hedge fund vehicles, are characterized by high expected alpha, high tracking error, and high Active Share, or conviction. These funds have a low number of securities (< 50), high expense ratios, and high marketing costs.
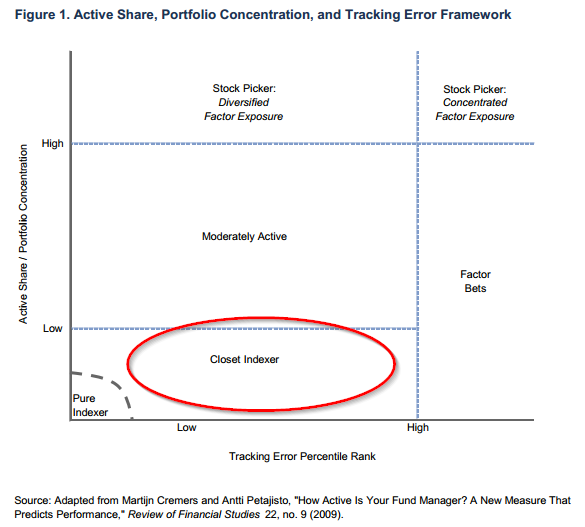
Smart beta portfolios which contain 100’s of stocks are–by construction–low-alpha, low-mid tracking-error, closet-index products. The chart below, taken from a wonderful piece by Cambridge Associates, highlights the breakdown of the investments industry.
Smart Beta
Financial Engineering Smart Beta Portfolios
We examine two common investment strategies from 1963 through 2013: Value and Momentum (i.e., relative strength).
- Value: Value strategies tilt towards stocks that are cheap on some measure of fundamentals to price.
- Momentum: Momentum, or relative strength, strategies tilt towards stocks that have had strong performance relative to other stocks in the marketplace.
There are 100’s of ways in which an investor could express value or momentum, but let’s be frank–they are all 90% correlated and essentially the same thing, at the margin.
Value-based Smart Beta
Let’s first tackle Value. We create four annually-rebalance investment strategies:
- Replication_VALUE: 70% invested in the Universe and 30% invested in Concentrated_VALUE.
- Diluted_VALUE (Smart Beta or Closet Index): Identify the largest 500 stocks; rank the 500 stocks on book-to-market; select the top 33.33% cheapest stocks; Value-weight the portfolio; annually rebalance.
- Concentrated_VALUE (Active Beta or High Active Share): Identify the largest 500 stocks; rank the 500 stocks on book-to-market; select the top 5% cheapest stocks; Equal-weight the portfolio; annually rebalance.2
- Universe: Identify the largest 500 stocks; Value-weight the portfolio; annually rebalance.
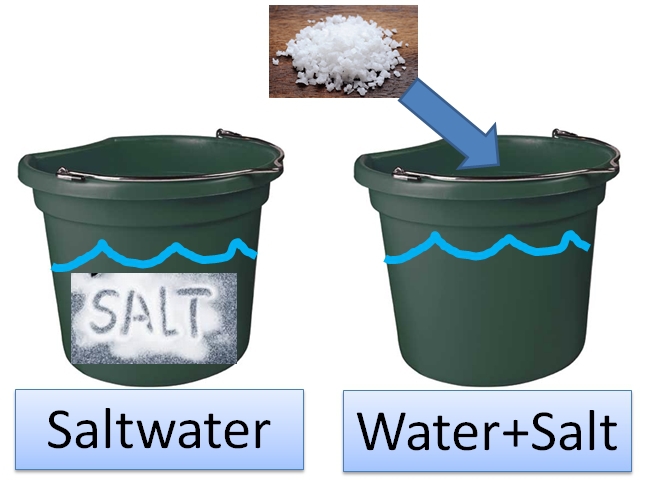
We hypothesize that one can replicate the performance of the Diluted_VALUE, or a “Smart beta” value strategy, by simply holding the passive universe and combining the universe exposure with a highly active share exposure to value. One can think of our experiment as a chemistry experiment. We are essentially comparing 2 buckets of water:
- Bucket #1 is full of saltwater (Diluted VALUE) – “Smart Beta”
- Bucket #2 is full of freshwater, but we dump a concentrated salt square into the water. (Universe + Concentrated_VALUE) – self-constructed “Smart-Beta” portfolio
Smart Beta
The question is the following:
- Once the salt dissolves in Bucket #2, will Bucket #1 and Bucket #2 be the same thing?
Summary Statistics
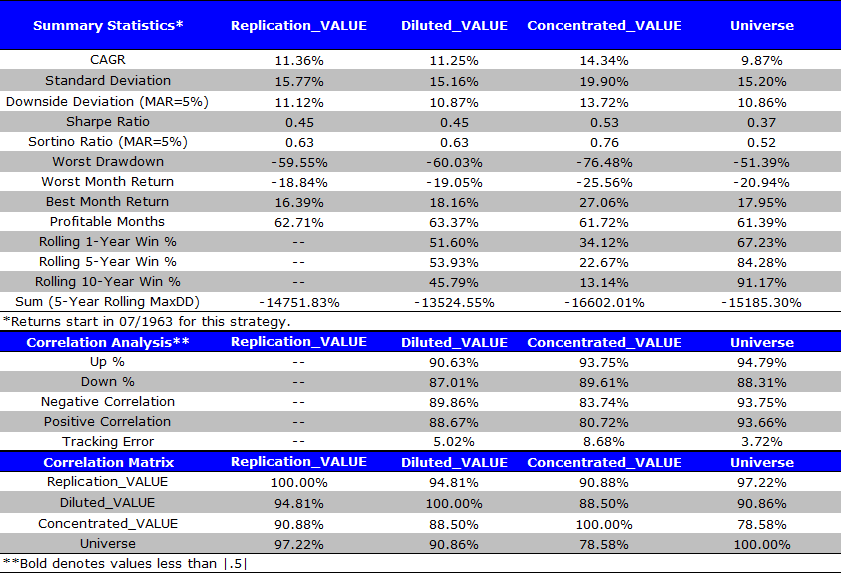
We want to focus on Replication_VALUE (our Water+Salt Bucket #2) and Diluted_VALUE (our saltwater Bucket #1). Bucket #1 represents “smart beta” and Bucket #2 represents one portion universe (70%) and one portion concentrated value (30%), or a self-constructed “smart beta” portfolio.
The first thing we notice is that Replication_VALUE and Diluted_VALUE have a 95% correlation. We also notice that all of their summary statistics are essentially the same.
The results are hypothetical results and are NOT an indicator of future results and do NOT represent returns that any investor actually attained. Indexes are unmanaged, do not reflect management or trading fees, and one cannot invest directly in an index. Additional information regarding the construction of these results is available upon request.
It sure looks like Bucket #1 ~ Bucket #2.
We are reminded of the duck test: if it looks like a duck, swims like a duck, and quacks like a duck, then it is probably a duck. Similarly, these buckets look awfully similar. It would seem that our Replication_VALUE looks like, swims, and quacks like Diluted_VALUE.
How about a chart of Bucket #1 and Bucket #2? The two strategies’ growth are almost identical.
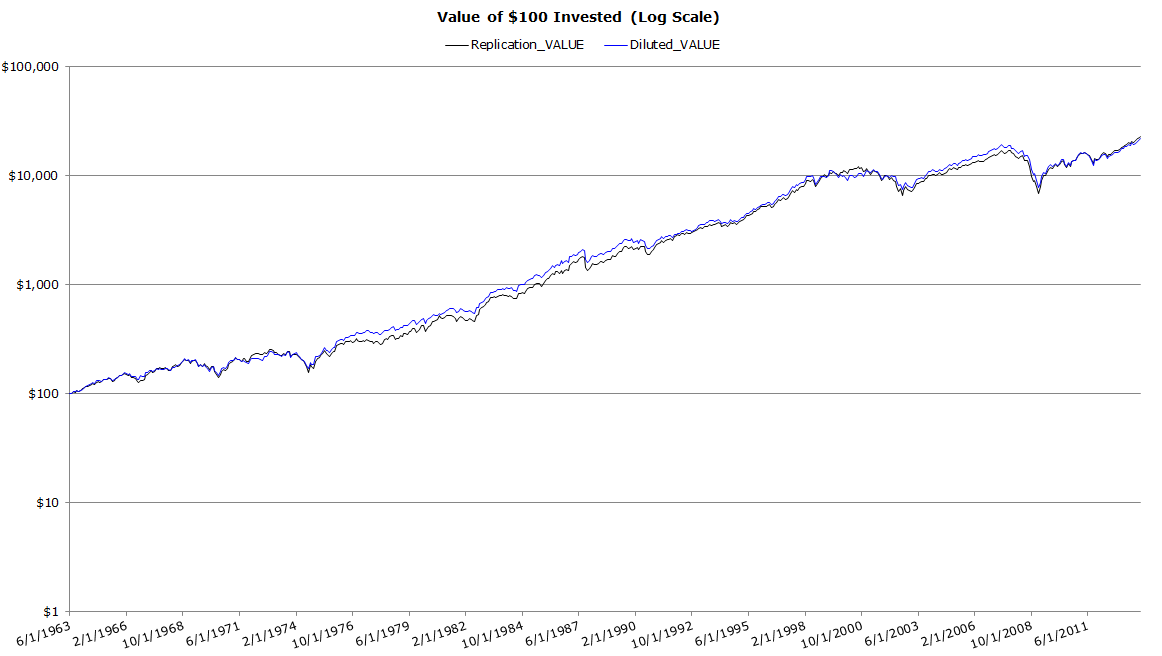
The results are hypothetical results and are NOT an indicator of future results and do NOT represent returns that any investor actually attained. Indexes are unmanaged, do not reflect management or trading fees, and one cannot invest directly in an index. Additional information regarding the construction of these results is available upon request.
Momentum-based Smart Beta
Now we tackle momentum.
We create four monthly-rebalanced investment strategies:
- Replication_MOM: 70% invested in the Universe and 30% invested in Concentrated_MOM.
- Diluted_MOM (Smart Beta or Closet Index): Identify the largest 500 stocks; rank the 500 stocks on 2-12 month return; select the top 33.33% momentum stocks; Value-weight the portfolio; monthly rebalance.
- Concentrated_MOM (Active Beta or High Active Share): Identify the largest 500 stocks; rank the 500 stocks on 2-12 month return; select the top 5% momentum stocks; Equal-weight the portfolio; monthly rebalance.2
- Universe: Identify the largest 500 stocks; Value-weight the portfolio; annually rebalance.
Similar to our results on a hypothetical smart-beta “value” portfolio, we hypothesize that one can replicate the performance of the Diluted_MOM, or a “Smart beta” momentum strategy, by simply holding the passive universe and combining the universe exposure with a highly active share exposure to momentum. Similar to value, Replication_MOM and Diluted_MOM have a ~95% correlation. Looks like another duck. We also notice that all of their summary statistics shown below are essentially the same.
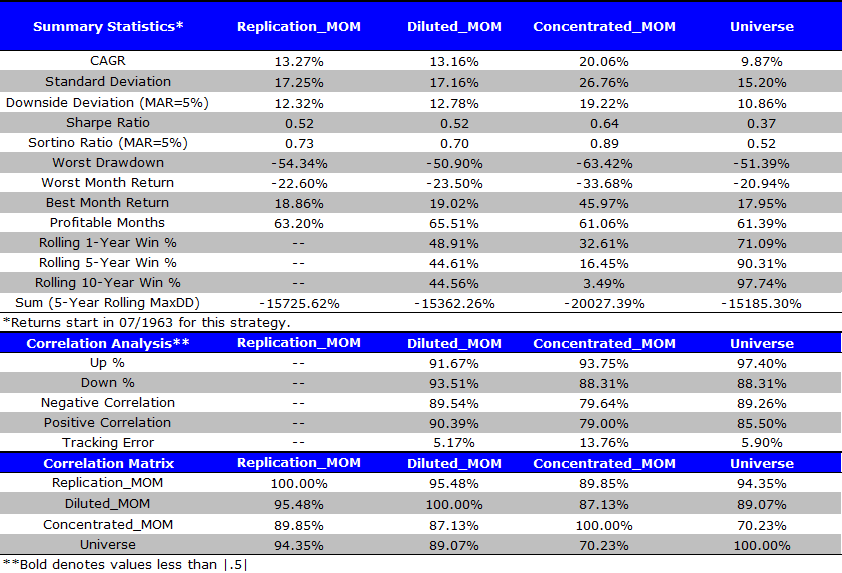
The results are hypothetical results and are NOT an indicator of future results and do NOT represent returns that any investor actually attained. Indexes are unmanaged, do not reflect management or trading fees, and one cannot invest directly in an index. Additional information regarding the construction of these results is available upon request.
![Momentum-based Smart Beta_performance]](https://alphaarchitect.com/wp-content/uploads/2014/10/Momentum-based-Smart-Beta_performance.png)
The results are hypothetical results and are NOT an indicator of future results and do NOT represent returns that any investor actually attained. Indexes are unmanaged, do not reflect management or trading fees, and one cannot invest directly in an index. Additional information regarding the construction of these results is available upon request.
The invested growth chart highlights that Bucket #1 is the same as Bucket #2. Quack, quack.
Practical Implications
The examples above highlight that one can replicate a “smart beta,” or a diluted factor portfolio, by simply combining a passive portfolio and a highly concentrated, or active, portfolio.
But who cares?
Everyone should care. Or at least any investor who values their wealth should care. To highlight why investors should care, we can take a page from no-arbitrage option pricing models. The essence of these models is that assets which are effectively the same thing should sell at the same price, or there are arbitrage opportunities (e.g., buy the cheap red apple and sell the expensive crimson apple).
How does this apply in the context of financially engineered smart beta portfolios?
Let’s assume the diluted_VALUE or diluted_MOM smart-beta ETF described above has a expense ratio of 45 bps. This portfolio is Bucket #1 in our illustration.
But we can also buy Bucket #2, which is 70% invested in a passive ETF, which costs 5 bps, and 30% in a concentrated value ETF, which costs us X bps.
To maintain the same price for the Smart beta portfolio and the engineered portfolio, we have the following equation:
- smart_beta_price = passive_%*passive_costs + (1-passive_%)*active_costs, which allows us to solve for active_costs
- active_costs = [smart_beta_price-(passive_%*passive_costs) ] / (1-passive_%)
Using the applied example in the analysis above, which highlights that a 70% allocation to passive and a 30% allocation to active is equivalent to a diluted, or smart beta fund, we can plug data in our math equation to identify the cost of the smart beta fund’s active component:
- smart_beta_price = 45 bps (generic Smart Beta value fund ETF)
- passive_% = 70%
- passive_costs = 5bps (ie. Generic S&P 500 ETF)
- active_costs = ?
Now we can plug our variables into the smart_beta_price equation:
- active_costs = [smart_beta_price-(passive_%*passive_costs) ] / (1-passive_%):
- active_costs = (45bps-70%*5bps ) / 30% = 138.33 bps
Wow. So the implicit cost of active management for the example above is 138 bps–probably surprising for many buyers of “smart beta” products.
Yikes–An implied 1.38% management fee for active management!
Stepping back, in the grand scheme of active offerings, 1.38% delivered via a tax-efficient ETF vehicle isn’t terrible, but it would be nice if there were truly active exposures an investor could purchase that wasn’t that expensive. Unfortunately, identifying truly active funds is a challenge and getting them at an affordable cost is almost impossible. Nonetheless, at Alpha Architect we are trying to solve this problem and be one of the first firms to deliver affordable active management.
Footnotes:
- Cremers, K.J. Martijn, and Antii Petajisto, 2009, How Active Is Your Fund Manager? A New Measure That Predicts Performance, Review of Financial Studies 22, p 3329–3365.
- We use equal-weights for the concentrated portfolios to ensure a single large stock doesn’t dominate the entire portfolio and skew the results (e.g., a $500B company gets coupled with 24 $5B companies). This introduces a small size tilt component, but the fact we are only looked at the largest 500 stocks implies that nothing is that small or illiquid.
References[+]
| ↑1 | Note, Stig and Preston have a great introductory video course on how to pick ETFs |
|---|
About the Author: Wesley Gray, PhD
—
Important Disclosures
For informational and educational purposes only and should not be construed as specific investment, accounting, legal, or tax advice. Certain information is deemed to be reliable, but its accuracy and completeness cannot be guaranteed. Third party information may become outdated or otherwise superseded without notice. Neither the Securities and Exchange Commission (SEC) nor any other federal or state agency has approved, determined the accuracy, or confirmed the adequacy of this article.
The views and opinions expressed herein are those of the author and do not necessarily reflect the views of Alpha Architect, its affiliates or its employees. Our full disclosures are available here. Definitions of common statistics used in our analysis are available here (towards the bottom).
Join thousands of other readers and subscribe to our blog.