Our mission is to empower investors through education. This mission is our passion and what drives us to go to work every day. But this mission is not our product. Our product is Affordable Alpha: We seek to deliver “alpha” (highly differentiated risk/reward profiles) at low costs, thereby giving sophisticated investors a higher chance of winning, net of fees and taxes.
Here is a video describing our firm and why it exists:
Here is an information deck outlining our firm:
- Firm Overview (Who we are)
A PDF version of this post is available here.
Why Affordable Alpha?
We are based outside of Philadelphia, roughly 15 minutes from Vanguard’s campus.

Vanguard is the gentle giant of the region, and we welcome their business model and vision for financial services: transparency, affordability, and disintermediation. We also know competing against Vanguard in cheap non-differentiated, “commodity” products is a fool’s errand. Firms we greatly respect, such as DFA, AQR, and Avantis, are learning this lesson the hard way. To us, Vanguard is like Wal-Mart (or maybe Amazon.com). And when you need the Huggies diaper mega-pack, there’s no better place to make the purchase! But we also know that Vanguard can’t effectively compete in all areas — especially when it comes to highly differentiated, limited capacity concentrated factor strategies. They don’t get out of bed unless a strategy can manage billions of dollars with little market impact.
In contrast, because of our limited asset base, focus on technology, and extensive research capabilities, we feel confident in our ability to compete as a boutique asset manager. See below for a diagram of how we view the situation and the different characteristics of boutique and mass-market asset managers.(1)
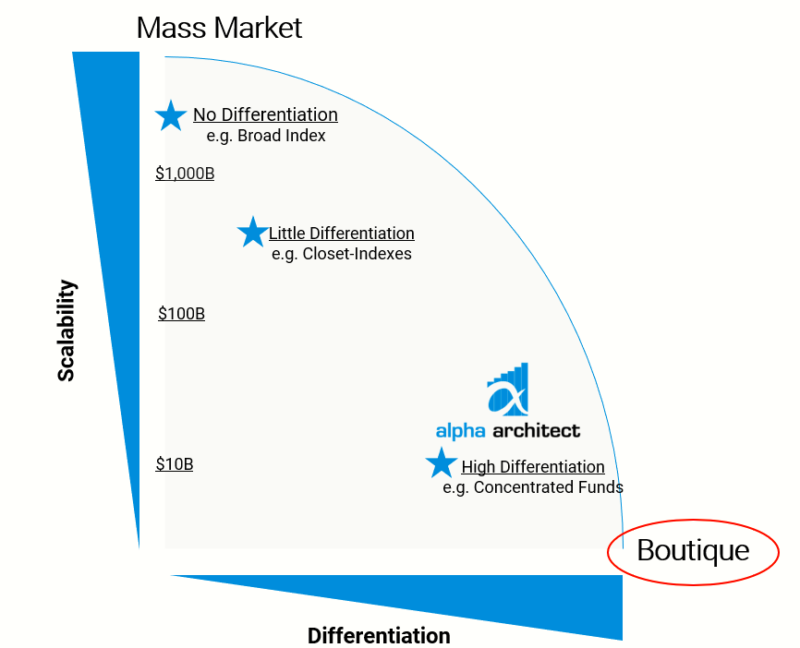
Here is a quick summary of the generic differences between boutique and mass-market asset managers:
- Research-focused versus distribution-focused
- Consultative selling versus aggressive outbound selling
- Segmented marketing versus scale marketing
- High insider ownership versus low insider ownership
- Flat and flexible versus hierarchical and rigid culture
- High active share versus closet-Indexing
- Limited scalability versus high scalability
So where do we land when it is all said and done?
Well, we let Vanguard be Wal-Mart, and we will focus on thriving where Vanguard can’t. But who is playing in our space, and what are they doing?(2) Welcome to the land of “active” managers. When we look at the active management industry, we observe two key trends:
- Costs are arguably too high.
- Not everyone is truly “active,” or genuinely different than a passive index fund. They’re essentially posers.
First issue: high costs
Today’s active manager faces a dilemma: How can I get my great idea to investors? Answer: Pay someone (distribution costs). For decades, active managers have relied on distribution networks to sell, market, and advertise their products. Remember when the vacuum salesperson came to your door and introduced the Suck-O-Matic into your life? You didn’t wake up realizing you needed the Suck-O-Matic, but once you saw the demo, heard the pitch, and made friends with the Sales Rep, how could you not have the Suck-O-Matic in your home? Same story with financial services. You woke up not thinking about the GrayPebble QuantBeta Triple Arb Macro-Micro Bond Fund, but when you saw Ernie Els wearing their logo, and your Financial Advisor told you how great it was, you went for it.
Today, most financial products are sold, not bought. And salespeople are extremely expensive (and persuasive!). We decided to invert the problem. Make products people want to learn about, understand, and these consumers can approach us when it makes sense. In short, develop strategies that people want to buy, not products that sales reps want to sell. We’ll leverage our background as researchers and educators to inform the public about strategies that make sense, and the right investors (sophisticated, want to learn, etc.) can come to us. Minimize distribution costs(3) and deliver affordable alpha-focused products.
Second issue: Avoid Closet Indexing
Just because someone says they are a value investor doesn’t mean they are following a value investing approach. Going back to our Wal-Mart example, we came across several types that were marketing gourmet French mayonnaise in tiny two-ounce bottles. Unfortunately, they were in the back of their kitchen spooning the Wal-Mart brand mayo into fancy jars and selling it for $20 a pop! It sounds ridiculous, but we see it all the time.
To ensure consumers can’t get duped, we decided to be 100% transparent with our processes. No black boxes, no mystery strategies, no secret sauce. Our two-ounce gourmet mayonnaise may not be what every investor needs/wants, but we’ll seek to deliver what we say we’ll deliver, and it we’ll seek to be affordable.(4) A firm was born. Let’s get costs contained, and let’s deliver on our promise of differentiation. We think alpha strategies can work for the investor, but they probably won’t work for a mutual fund manager, hedge fund guru, or sales rep. We can make active investing affordable, transparent, and intellectually honest. Alpha Architect (AA) seeks to deliver Affordable Alpha (AA):
- Affordable: Non-scalable active strategies are scarce and expensive to produce. These products can never be priced like a Vanguard fund, but they also don’t need to be “two and twenty.”
- Alpha: Portfolios need to be different to be differentiated. We are not closet-indexers (e.g., “smart beta”) and we build portfolios that seek to deliver unique risk and reward profiles.
Important to note: Our strategies will be delivered in the context of a broader mission to empower investors via education, and we will adhere to our four core beliefs:
- Transparency
- Systematic decision-making
- Evidence-based investing
- Win-wins
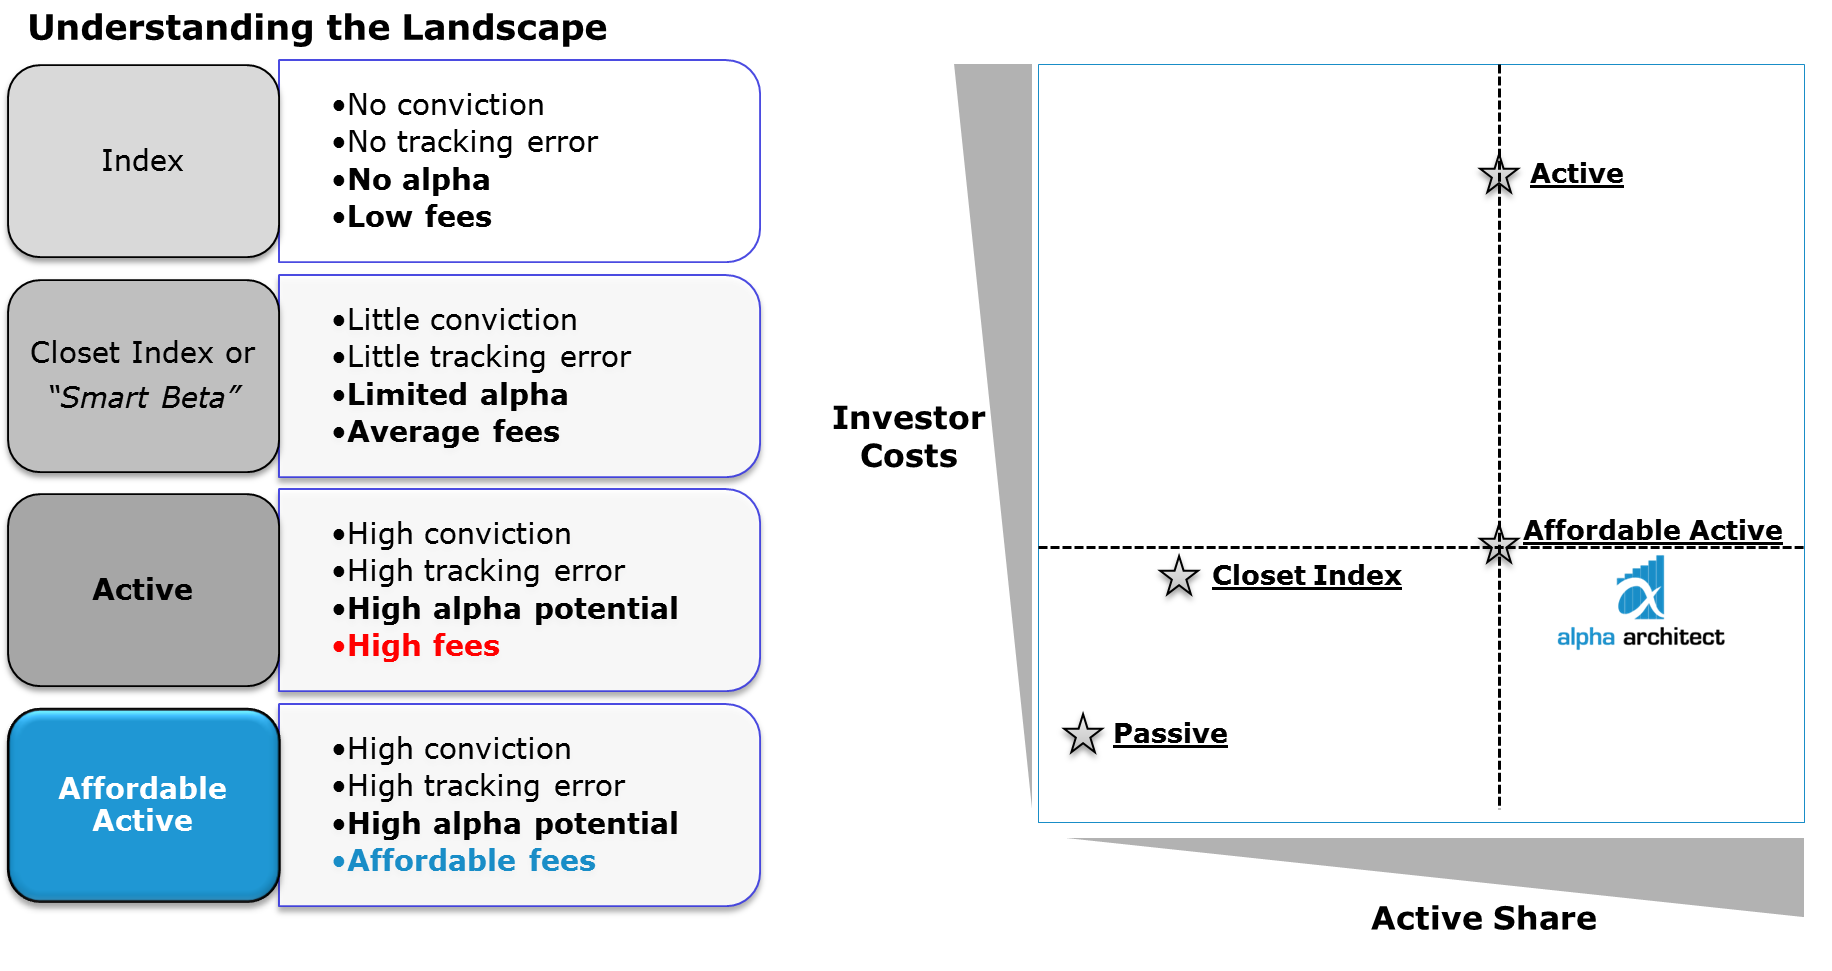
Understanding the Asset Management Landscape
We hope that the framework we outline below will allow investors to differentiate among investment management products based on a few key characteristics.
First, let’s define a few concepts that are central to understanding the investments industry:
- Alpha: Formally, alpha represents the intercept estimate from a regression of an investment strategy against various risk factors. In English, alpha is exposure to a different risk/return profile that may not be in your current portfolio (which is highly valuable).
- Tracking Error: The standard deviation between a strategy’s returns and a benchmark’s returns. In other words, how closely a portfolio follows, or “tracks,” an index. To the extent one cares about being close to a benchmark, tracking error is important. P.S. If you want to be vastly different than the market, tracking error is a positive indicator.
- Active Share: This measure quantifies how different a manager invests compared to a benchmark. A good proxy for active share is the number of securities in a portfolio. For example, a manager that holds 50 equally-weighted stocks will likely have a much higher Active Share than a manager that holds 500 market-weighted stocks. High Active typically means High Tracking Error and vice versa (not always).(5)
- Passive Index: By construction, passive index portfolios are designed to have no differentiation from the broad market. A good example of an index strategy is the Vanguard S&P 500 Index Fund. This fund does not attempt to add Alpha, but seeks to match the performance of the S&P 500 index with minimal tracking error. Here is a post on the subject.
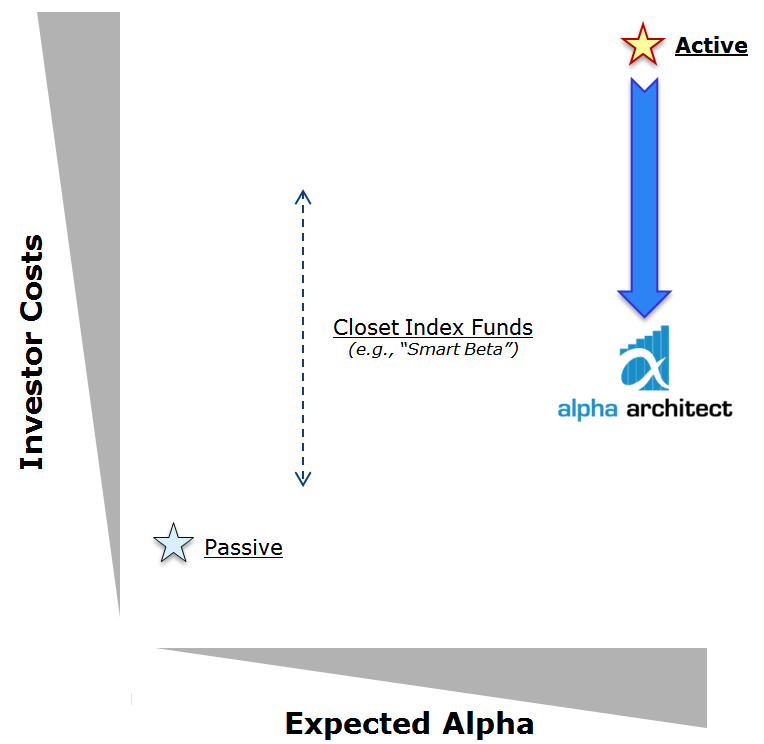
With some basic concepts, we can now explore the asset management industry. We break the industry into three main categories:
- Passive Index Products: Index (“Passive”) products offer no alpha, no tracking error, and no Active Share.
- These strategies, typified by Vanguard’s products, have a high number of securities, low expense ratios (<20bps), and low marketing costs. (Think about the Walmart example).
- “Closet Index” or “Smart Beta” Products: Closet Index products, sometimes referred to as “smart beta,” offer little differentiation, little tracking error, and little Active Share.
- These strategies typically have many securities, low-to-high expense ratios (25-100bps), and high marketing costs. (Think Sales Rep marketing fancy mayo, but spooning Walmart mayo into tiny bottles).
- Active Products: Active products, often delivered via mutual fund or hedge fund vehicles, are characterized by high expected alpha, high tracking error, and high Active Share.
- These strategies have a low number of securities (<50), high expense ratios (75bps – 200bps+), and extremely high marketing costs.
To win in the Passive Index game, one needs to be Vanguard. To win in Closet Index / Smart Beta or Active an asset manager needs to be a marketing machine. Alpha Architect is not Vanguard and is not a marketing machine. So we are creating our category: Affordable Alpha.
- Affordable Alpha Strategies: Alpha Architect strategies are characterized by limited scalability (a limited amount of $ can invest), high expected alpha (different), high tracking error and Active Share (don’t track a passive index).
- These strategies are backed by intense research efforts, delivered at affordable expense ratios, and marketing costs are kept to a minimum.
The 4 different categories of asset management products are summarized in the table below:
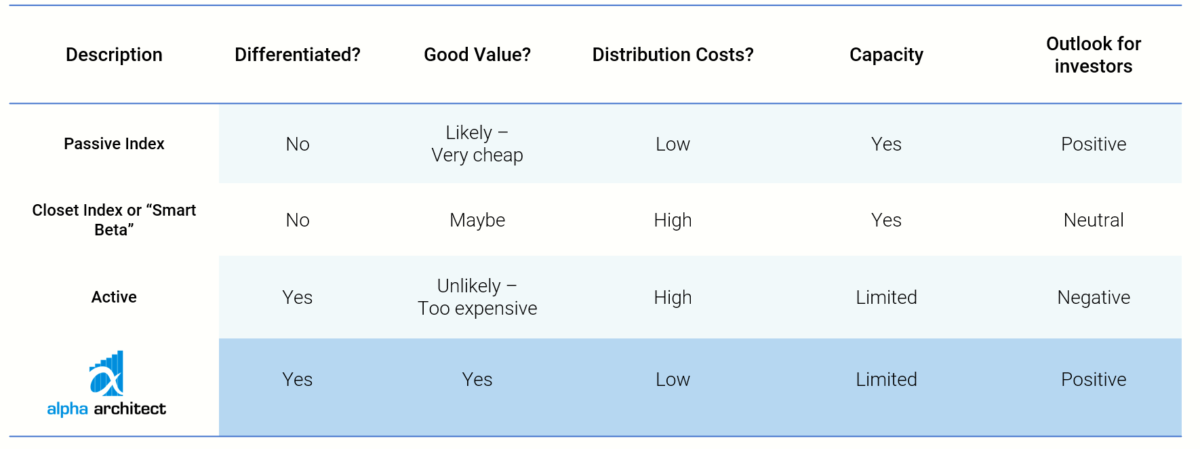
All four categories can arguably serve the investor, with varying costs/benefits to each. We are not competing with Passive Indexers, or Closet Indexers / Smart Beta. So we will not directly comment on the validity of these approaches. Our competitive angle is squarely targeted at expensive active strategies, and our mission is to make these high-expected-performance strategies more affordable.
What We Seek to Deliver: Affordable Alpha
Two words define what we seek to deliver: Affordable, Alpha. We will briefly describe what we mean by each of these terms. First, we discuss the most important aspect of what we do: generate alpha. Next, we will discuss affordability and why costs matter. Our goal is to highlight Alpha Architect’s product goal, which is to deliver higher net benefits for long-term investors who seek to invest in active factor strategies.
Alpha
Condition #1: Be Different
Charlie Munger, at the 2004 Berkshire Hathaway Annual Meeting, is quoted as saying, “The idea of excessive diversification is madness…almost all good investments will involve relatively low diversification.” Of course, you still need to be a good investor, but the point remains: too much diversification laid on top of a good investment strategy is a bad thing. Munger calls it: “diworsification.”
Diversification is a dual-edged sword:
- Owning more stocks can lower a portfolio’s risk profile (i.e. good!).
- Owning more stocks than necessary can dilute performance (i.e. bad!).
The data supports Munger’s remarks: We have posts on value and momentum strategies and highlight the direct relationship between portfolio concentration and past performance. The million-dollar question: What is the optimal trade-off between performance and risk?
Let’s first tackle risk, which is broken down into two types: Idiosyncratic and Systematic. Idiosyncratic risk is the risk we can control via diversification. Idiosyncratic risks are risks of a stock that are uncorrelated with other risks. Examples include a building catching on fire, a hurricane, or hiring Travis Kalanick to run your company’s gender-equality program.
But idiosyncratic risk cuts both ways: a company can benefit from, say, a favorable lawsuit outcome or a positive FDA ruling. When investors hold a large portfolio of stocks, these idiosyncratic risks–which are unrelated–cancel each other out, on average.
Systematic risks are risks we can’t diversify away. An example might be the general economy going into a depression. If people in the economy aren’t spending money, all companies are impacted. No matter how many we hold, the risk stays the same. To get a better sense of how increasing portfolio size affects portfolio volatility in the context of stocks, we look to the academic literature.(6)
The figure below, highlights the relationship between portfolio size and risk. In the top left corner, we have the portfolio risk associated with holding one single company in a portfolio. In the bottom right, we have the portfolio risk associated with holding 1,000 companies in a portfolio. Most people understand that risk will decrease as you increase your holdings. What’s fascinating, however, is the rapid “ski slope” shape of the graph. Notice that portfolio risk plummets as you grow from 1 to 30 stocks, declines from 30 to 50, and flatlines after that. For idiosyncratic risk, holding 50 or 1000 stocks is almost the same.
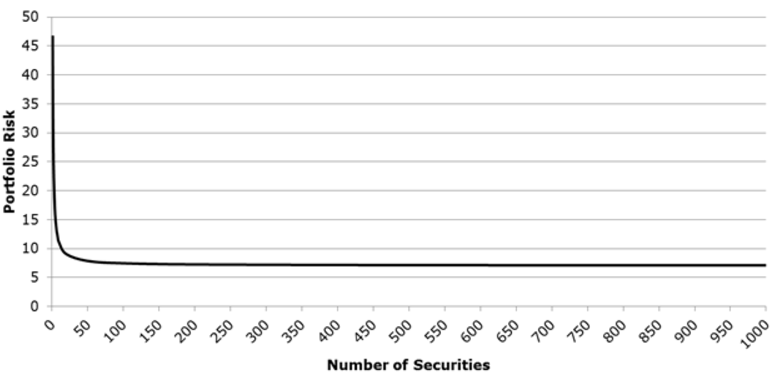
This is what diworsification is all about! Additional diversification beyond ~50 stocks prevents our portfolio from concentrating on stocks we feel are “undervalued.” Warren Buffet holds a small portfolio of stocks — to ensure he doesn’t completely blow up – but he doesn’t hold 1,000 companies and throw away any edge.
Again, let’s go to the data. Let’s take a simple high-performance value factor: EBIT/TEV (a version of an enterprise multiple). Similar to other value metrics, there is a clear historical relationship between EBIT/TEV and future stock returns. High EBIT/TEV stocks earn higher returns than low EBIT/TEV stocks. In English, this is the so-called value premium (i.e., buy cheap stuff, hold your nose). First, a quick description of the study we conducted from 1964-2013. We identify firms in a universe of mid/large-cap stocks with information to calculate enterprise multiples. In 2013, this equated to a universe that looks at stocks with a market capitalization of ~$2B and up. With our universe of mid to large-cap firms, we split firms into three differently sized portfolios based on EBIT/TEV measures: Top third EBIT/TEV (~279 stocks), Top quintile EBIT/TEV (~167 stocks), and Top decile EBIT/TEV (~83 stocks).
In the table below, we display the summary statistics for the following three portfolios (here is the source):
- EBIT Cheap Decile = Value-Weight, monthly re-balanced portfolio of cheapest 10% of EBIT/TEV stocks
- EBIT Cheap Quintile = Value-Weight, monthly re-balanced portfolio of cheapest 20% of EBIT/TEV stocks
- EBIT Cheap Tercile = Value-Weight, monthly re-balanced portfolio of cheapest 33% of EBIT/TEV stocks
| Summary Statistics | Cheap Decile | Cheap Quintile | Cheap Tercile |
|---|---|---|---|
| CAGR | 15.72% | 14.42% | 13.43% |
| Standard Deviation | 17.64% | 16.02% | 15.25% |
| Sharpe Ratio (RF = T-Bills) | 0.64 | 0.610 | 0.58 |
The results are hypothetical results and are NOT an indicator of future results and do NOT represent returns that any investor actually attained. Indexes are unmanaged, do not reflect management or trading fees, and one cannot invest directly in an index. Additional information regarding the construction of these results is available upon request.
The results are clear: more concentration increases returns (but also increases volatility). An increase in volatility is expected (remember our ski slope graph still has lower volatility at 1000 not 50). But what should an investor choose? What is the tradeoff between returns and volatility? One answer: The Sharpe ratio.
The Sharpe Ratio is one commonly used, but flawed measure to calculate the tradeoff between returns and volatility. More Sharpe = Better tradeoff between risk and return. Based on Sharpe ratios, the evidence above suggests that concentration is a better risk-adjusted bet. You get a net performance boost by concentrating your holdings. It seems Munger is right: to the extent, you believe you have an edge, less diversification is desirable and often cheaper.
Condition #2: Have an Edge
Great, so all we need is a good strategy that works. Easy, right? Formally, alpha, or “edge,” is the intercept estimate associated with a factor regression using an investor’s favorite factor model (see here for an in-depth discussion). Informally, “alpha” can be interpreted as skill, luck, and everything in between. To some, alpha represents brains, to others, luck. To us, alpha represents an attractive investment opportunity rooted in evidence that is difficult to exploit for behavioral reasons. Humans are imperfect creatures. We eat cheeseburgers even though we know kale is better for us. We buy the Baywatch Collectors Edition box set rather than save for retirement. We do stupid things.
For investing, we believe extreme investor education and following a structured process can save us from ourselves. And we must. Human behavior can influence investment decisions, sometimes in ways that hurt investors. This is the central premise in behavioral finance. Warren Buffett is attributed as saying that investing is simple but not easy. Similarly, integrating our understanding of human behavior into an investment process is simple but not easy.
How, specifically, does our behavior impact stock prices?
Despite our best intentions, our investment approach is not always governed by rationality. In particular, our judgment and decision-making can be significantly affected by intuition, a form of abstract, automatic thinking that can override our reason. Faulty intuition and other forms of irrationality can cause us to do the wrong thing and can also create mispricings in the market. We call this behavioral bias. One example of behavioral bias affecting stock prices is the human tendency to extrapolate short-term patterns and ignore long-term trends (representative bias). Academic research shows that representative bias likely explains part of the “value premium,” which describes the large spread in realized returns between value stocks and growth stocks.(7)
But this phenomenon only confirms that there are bad investors in the marketplace. Surprise. That alone, however, will not drive stock prices out of whack. Surely there are smart people, with supercomputers, that will send these Baywatch watching, cheeseburger eating cavemen back to their basements where they belong, right?
The second building block of behavioral finance requires an understanding of market frictions, often referred to as the “Limits of Arbitrage.”(8)
To understand the two components of behavioral finance (behavior and limits of arbitrage), let’s play a simple game of poker using the diagram below:
On one end of the table, we have our irrational investors. They drop their cards, they giggle when they get an Ace, and they ask people next to them, “Is it a good thing if all of my cards have the people’s faces on them?”
On the other side of the table is an institutional poker player hired by wealthy investors to play poker as best as possible. This poker player is a pure genius, mathematically calculates all probabilities in her head, and knows her odds better than anyone. Imagine that our super player, as a hired gun, has a few limits. “We need you to maintain good diversification across low numbers and high numbers. We also want to see a sector rotation between spades, aces, and clubs. Don’t take on too much risk with straights and flushes, stick to pairs as the market does…” No one would ever play poker like this. But in finance, this is how people play.
Now the cards are dealt. Super Player sees a great opportunity with a high chance of success, but it violates all the requirements of her investors. She doesn’t bet, and sure enough, she could have won big.
The two building blocks of behavioral finance–understanding bias (bad poker players) and arbitrage restrictions (great poker player restrictions)–combine to create opportunities for savvy long-term investors. The Efficient Market Hypothesis (the “EMH”) claims this phenomenon can’t exist. EMH claims that market prices reflect all publicly available information about securities. In our poker example, the Super Player will gobble up every opportunity perfectly and efficiently as revealed by the bad poker players. In the EMH view, prices will always reflect fundamental value–even when some market participants suffer from extreme behavioral bias. But we feel a strict interpretation of EMH is flawed since it assumes the costs of chasing the bad poker players’ mistakes are zero. In reality, exploiting investment opportunities created by bad poker players can be very costly (e.g., if you fail to maintain diversification across spades and clubs, we will fire you and get a different player).
In our poker example, the real path to doing well in the game is to find the right clients that will stick to a strategy. No need to sector rotate across suits, diversify away a good hand, etc. The arbitrage opportunity is marrying a good investment strategy with a good investment partner. Our investment strategies systematically exploit these opportunities because “smart money,” will typically get fired if they are given free rein to pursue a winning strategy over the long term. We explain this philosophy in great detail in our sustainable active investing piece. We also like to emphasize why our two biggest focus areas — concentrated value and momentum — can have terrible bouts of relative underperformance.(9)
Affordability
Warren Buffett obliquely references the concept of affordability in the context of stock-picking:
It’s far better to buy a wonderful company at a fair price than a fair company at a wonderful price. 10
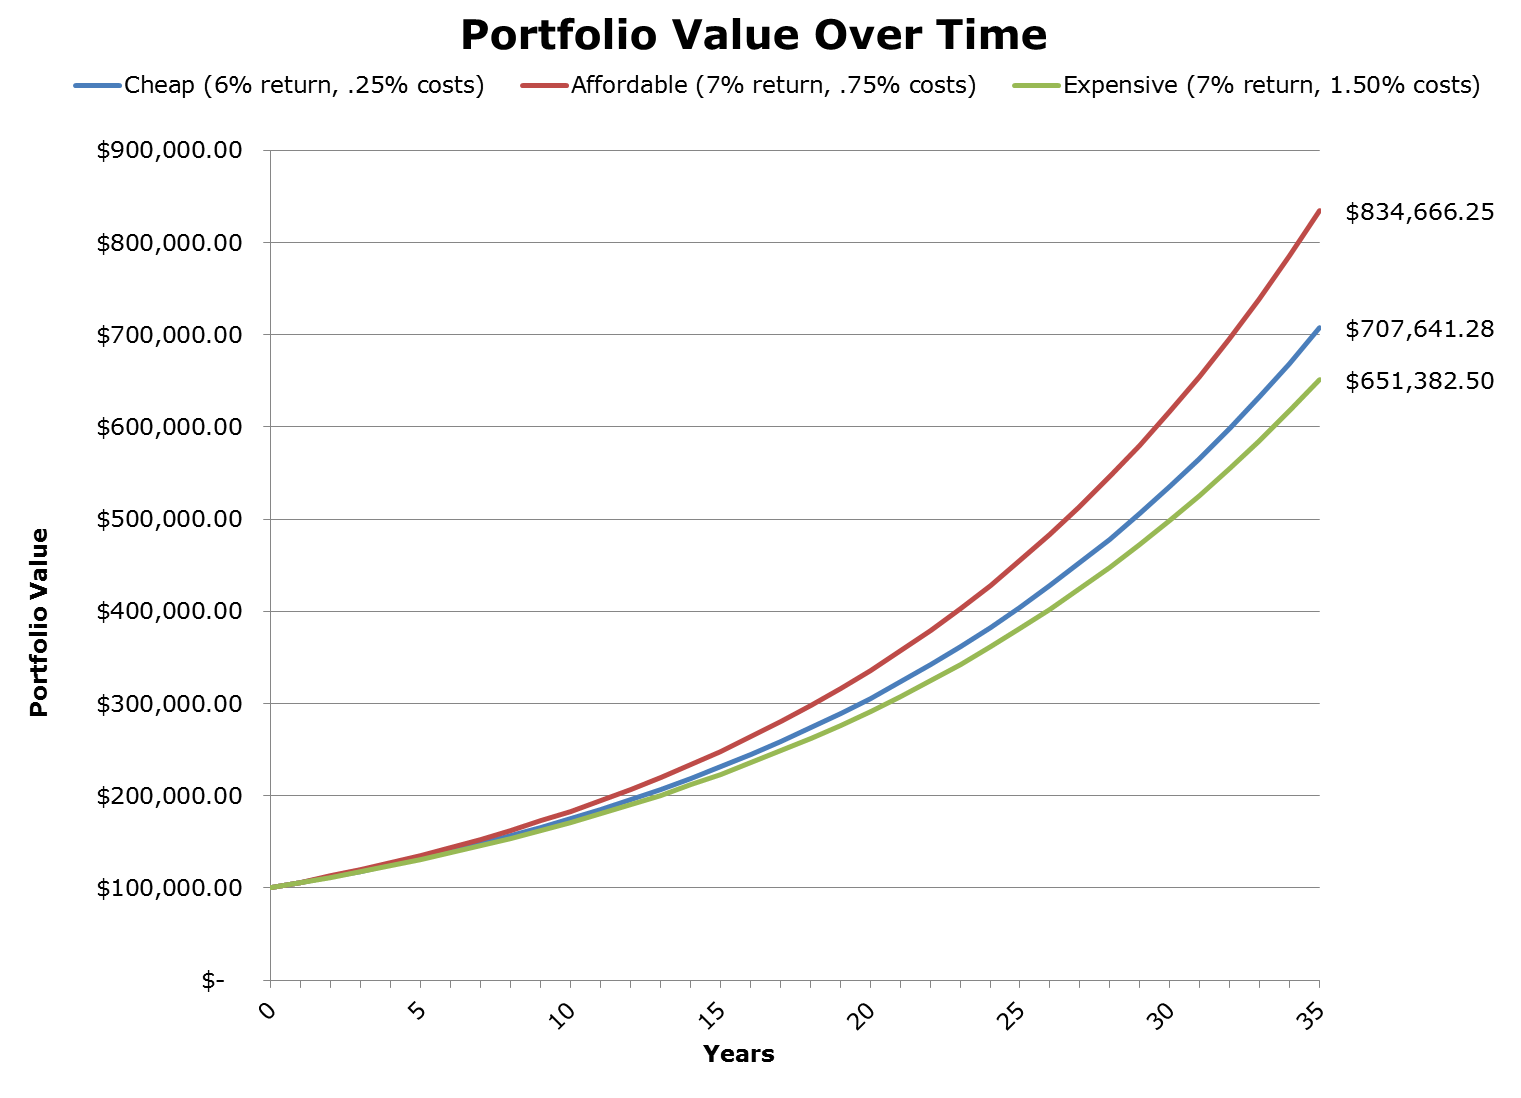
Most people understand the concept of affordability when they shop at the grocery store but lose sight of it when they shop for financial services. Let’s look at an example below with three shopping types. Our Expensive Shopper (green line) likes Goldman Sachs because it’s awesome to tell the ladies at the cocktail party that you bank with Goldman Sachs. Let’s even give them the benefit of the doubt that they outperform, but they pay 1.5% all-in. A cheap shopper (blue line) only focuses on price.
Finance is intimidating, we don’t want to invest all of this time in learning the nuance and methods; let’s just go to Walmart and get the cheap stuff. Perfectly reasonable. Now let’s examine an “affordable alpha” shopper that can follow a disciplined strategy but pays a little more. The figure below highlights why being an affordable-minded consumer of financial services can be a good financial decision for those that want to learn the difference in what they are investing in. Our Goldman Sachs shopper fared the poorest in his portfolio over time. Our cheap shopper did better, but our affordable investor, who weighed costs AND benefits, came out on top.(10)
Over time, other asset managers will evolve to embrace technology, and perhaps they will give up on the high-priced overhead. At least one would hope. But the real disruption in financial services revolves around distribution and going direct to consumers (e.g., individual investor or their advisors). Distribution is currently extremely expensive, and the clients foot the bill eventually. This model relies heavily on an intermediary.
Let’s look at the Old Model in the figure below.
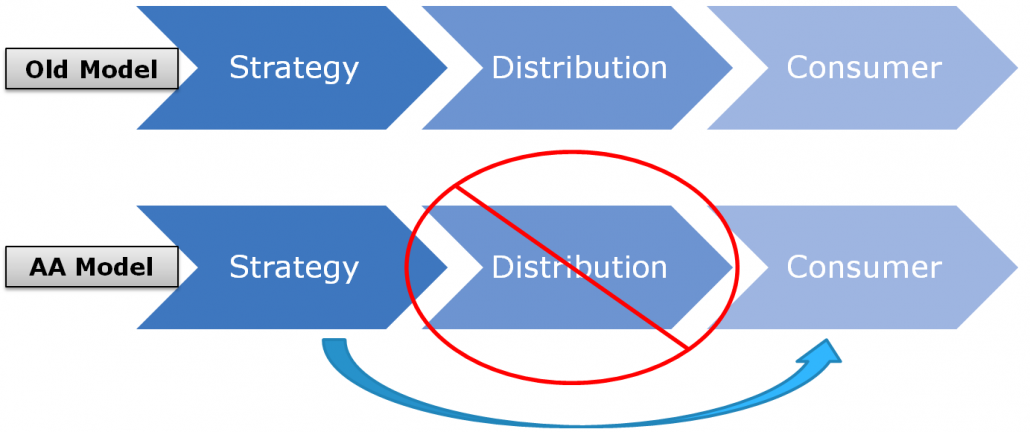
First, an asset manager develops an investment strategy ( “Strategy”), which is distributed by some means (labeled “Distribution”) to the investment public (labeled “Consumer’). A well-intentioned asset manager that wants to charge 75bps could be faced with a 75bps distribution fee, making the total product cost 150bps, or 1.5%. Half of the total fee goes to the middle person sitting between the Manager and the client. The consumer pays twice: once for the development of the strategy and once for a middleman. This is the status quo for today’s financial products.
One thing is certain: The asset manager and the consumer would both be better off if they could cut the middle person out. The client would save 75bps in fees, and the asset manager would have direct access to the client. The direct-to-consumer model (Affordable Alpha Model) represents where we think the future of financial services is headed. No middle people, fewer conflicts of interest, and more affordability.
How do we go direct to the consumer?
We focus on inbound marketing. We tell people what we do, why we do it, and how we do it, and they reach out to us for information and education. Our strategies are designed to be bought through genuine client interest, not sold via middle channels. Our approach efficiently taps into a self-selected group of investors who understand and appreciate our value proposition.
As alluded to earlier, minimizing distribution costs aren’t the only way we can minimize costs to deliver Affordable Alpha. Our dedication to low-cost infrastructure and reliance on technology ensures our viability as a going concern. In short, we run things cheaper and more efficiently than your average active manager. Sure, we would love to have box seats at Yankee Stadium, host wine and cheese events for our investors on the company yacht, and have three assistants for every employee. But we all know these things don’t add value to an investment portfolio. They merely add costs to the client. The money would be better spent on research and development or technology to improve our offerings.
Conclusion on Affordable Alpha
We believe that financial services will be more competitive, transparent, and client-friendly in the future. We want to be at the forefront of this new normal in investment management. Our particular focus is on the active management sector, and we desire to create a new category: Affordable Alpha. Alpha Architect seeks to generate higher net returns for long-term buy-and-hold investors.
To have confidence in our approach, which is unique and highly differentiated from others, one must understand our investment processes and the research behind them (our books and blog posts are a great place to get started).
We believe our approach to the markets makes sense for sophisticated, long-term, disciplined investors who don’t want generic passive indexes, or “closet-indexes.” We call these investors, “sustainable clients.” The central belief behind our “edge” is that we can couple patient and disciplined capital with innovative strategies. It all boils down to educating clients and making them better investors. And we should all want that.
References[+]
| ↑1 | Additional information for the figure on the left:
No Differentiation: Strategies in this category seek to deliver exposure to a broad set of securities in a market segment and are often characterized by many holdings and seek no active share. These strategies are commonly referred to as broad-market index funds. Little Differentiation: Strategies in this category seek to deliver exposure to a broad set of securities in a market segment and are often characterized by many holdings and seek low active share. These strategies are commonly referred to as closet-index funds or smart-beta funds. High Differentiation: Strategies in this category seek to deliver exposure to a narrow set of securities in a market segment and are often characterized by a small number of holdings and seek high active share. These strategies are commonly referred to as active funds or alternative funds. |
|---|---|
| ↑2 | Note: if you are a hedge fund manager charging 2/20 from your yacht in the Maldives, you will not like the next section. |
| ↑3 | one can never eliminate the value of an education-focused client-friendly salesperson |
| ↑4 | Note: if you are interested in this topic, the NY Attorney General has a great report on the issue with “closet indexing.” |
| ↑5 | Cremers, K.J. Martijn, and Antii Petajisto, 2009, How Active Is Your Fund Manager? A New Measure That Predicts Performance, Review of Financial Studies 22, p 3329–3365. |
| ↑6 | Elton and Gruber have multiple papers and books on the subject. Elton, E. and Martin Gruber, 1977, Risk Reduction and Portfolio Size: An Analytical Solution, The Journal of Business 50, p 415-437. |
| ↑7 | Lakonishok, J., A. Shleifer, and R. Vishny. 1994. Contrarian Investment, Extrapolation, and Risk. Journal of Finance 44:1541–78. |
| ↑8 | Schleifer, A. and R. Vishny, 1997, “The Limits of Arbitrage,” The Journal of Finance 52, p. 35-55. |
| ↑9 | Here is the value version of the same story. |
| ↑10 |
 This all sounds great, but one question remains: How can we deliver high-value services at lower costs than the competition? We deliver Affordable Alpha by reinventing the way business is done in financial services:
|
| ↑11 | Full credit to the United States Marine Corps for teaching us this. |
About the Author: Wesley Gray, PhD
—
Important Disclosures
For informational and educational purposes only and should not be construed as specific investment, accounting, legal, or tax advice. Certain information is deemed to be reliable, but its accuracy and completeness cannot be guaranteed. Third party information may become outdated or otherwise superseded without notice. Neither the Securities and Exchange Commission (SEC) nor any other federal or state agency has approved, determined the accuracy, or confirmed the adequacy of this article.
The views and opinions expressed herein are those of the author and do not necessarily reflect the views of Alpha Architect, its affiliates or its employees. Our full disclosures are available here. Definitions of common statistics used in our analysis are available here (towards the bottom).
Join thousands of other readers and subscribe to our blog.