Meb Faber tweeted an interesting question related to taxes, dividend payers, and the value premium the other day.
I’ll summarize the heart of the question:
How do dividend payers affect the value premium?
Instead of pontificating on the issue, we decided to directly address the question via empirical tests.
Analysis Details
Portfolio construction details:
- Construct equally-weighted portfolio each year on June 30th. (use market cap on June 30th, as per the Asness/Frazzini paper).
- Focus on mid/large cap stocks. (Firms’ market cap above the 40th percentile of NYSE firms, excluding financial companies).
- Sort on two measures (1) Book-to-Market (BM) and (2) by firms which paid dividends the prior year.
- Rebalance annually.
Results are gross of fees. All returns are total returns and include the reinvestment of distributions (e.g., dividends). Indexes are unmanaged, do not reflect management or trading fees, and one cannot invest directly in an index.
Important to note is that the universe of non-dividend paying mid/large cap companies is actually fairly small. We start our analysis in 1990 because of this fact. The decile portfolios have ~20+ stocks at around that time period (i.e. 1990–>). Prior to 1990, the decile portfolios only held 5-10 stocks–sometimes fewer–so we do not include those results.
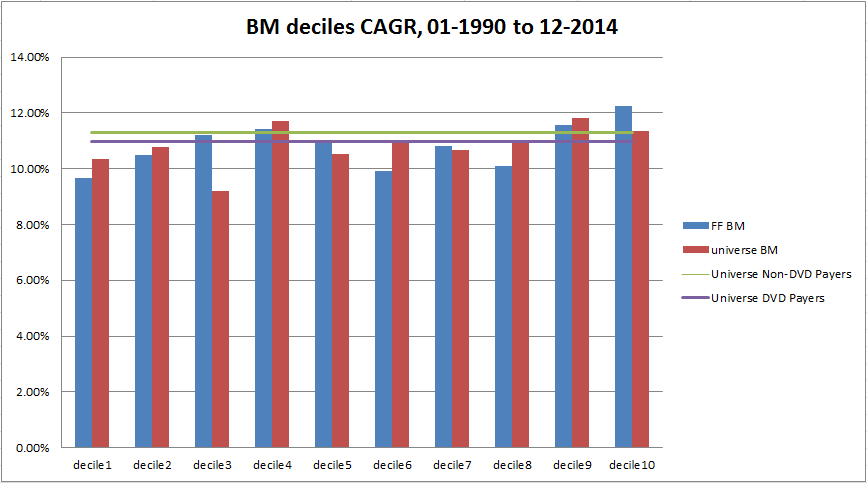
First, we dug into the performance of our book-to-market deciles since 1990 (see figure below) and compare them to the BM deciles obtained from the Ken French Data Library. The French BM deciles are value-weight across all market caps and use lagged market cap data, which is different than our construction. However, the empirical results below highlight that the distributions are approximately equal, with small differences.
The figure below highlights that BM has been a shoddy way to access the value premium in recent history. This is not too surprising if you follow our blog and our research, which highlights that the king of valuation metrics are enterprise multiples, not BM. Regardless, we’ll stick with BM since that is an academic and practitioner favorite.
The results are hypothetical results and are NOT an indicator of future results and do NOT represent returns that any investor actually attained. Indexes are unmanaged, do not reflect management or trading fees, and one cannot invest directly in an index. Additional information regarding the construction of these results is available upon request.
Dividend Payers vs. Non-Dividend Payers
Next, we look at how the BM deciles perform across dividend and non-dividend payers.

The results are hypothetical results and are NOT an indicator of future results and do NOT represent returns that any investor actually attained. Indexes are unmanaged, do not reflect management or trading fees, and one cannot invest directly in an index. Additional information regarding the construction of these results is available upon request.
The decile results divided by dividend payers/non-payers are noisy, but it appears as though the BM version of the value anomaly is driven, at least in part, by dividend paying companies. The deciles are roughly equal across BM for non-payers, but we see a more pronounced compound annual growth rate difference between cheap dividend payers and expensive dividend payers.
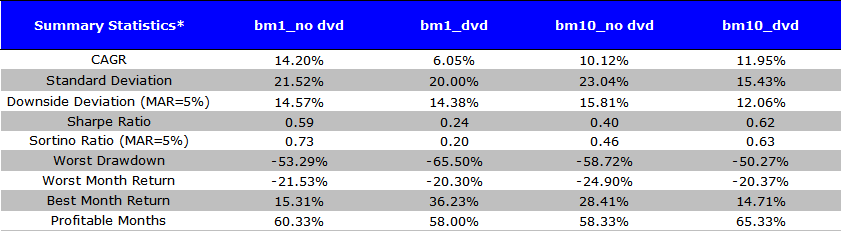
Here are the summary statistics over the period analyzed:
- bm1_no dvd = BM, decile 1, non payers
- bm1_dvd = BM, decile 1, payers
- bm10_no dvd = BM, decile 10, non payers
- bm10_dvd = BM, decile 10, payers
Does the BM value measure drive dividend payer/non-payer results?
The analysis above suggests that dividend payers drive the value anomaly, when the value anomaly is measured via book-to-market. But as we highlighted at the outset, BM has never been an effective valuation metric. We understand that it is “famous” and used by huge firms such as DFA, but why use a sub-optimal approach to systematic value-investing in the first place?
Here we focus on more effective valuation metrics—price-to-earnings ratios and enterprise values, or EBIT/TEV.
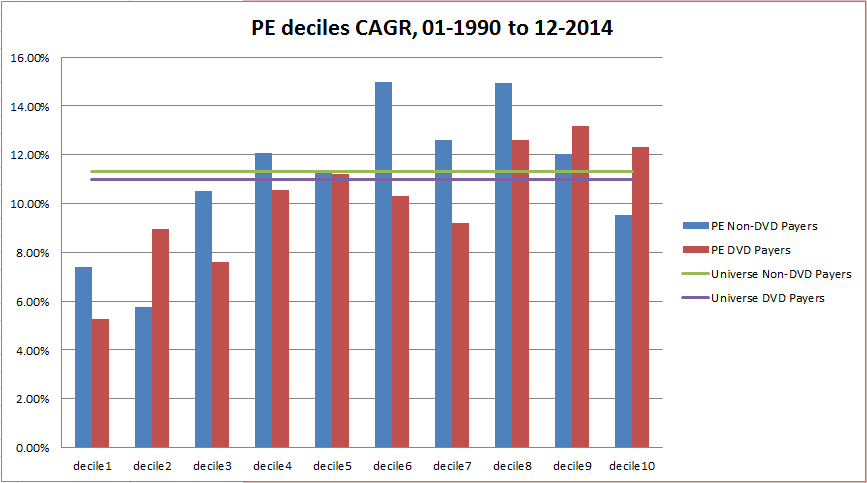
The decile splits between dividend payers and non-dividend payers across price-to-earnings (PE) ratios is pictured below:
The results are hypothetical results and are NOT an indicator of future results and do NOT represent returns that any investor actually attained. Indexes are unmanaged, do not reflect management or trading fees, and one cannot invest directly in an index. Additional information regarding the construction of these results is available upon request.
In contrast to the BM results, which clearly show that dividend payers drive the value anomaly, there doesn’t seem to be a clear cut relationship between the value anomaly and dividend payers when looking at PE ratios. Low PE dividend payers tend to outperform high PE dividend payers by a large amount, but low PE non-payers tend to beat high PE non-payers by a decent amount as well. From an empirical standpoint, it is harder to make the claim that the value anomaly–as measured by PE–is driven by dividend payers. One could say there is “weak” evidence for this claim.
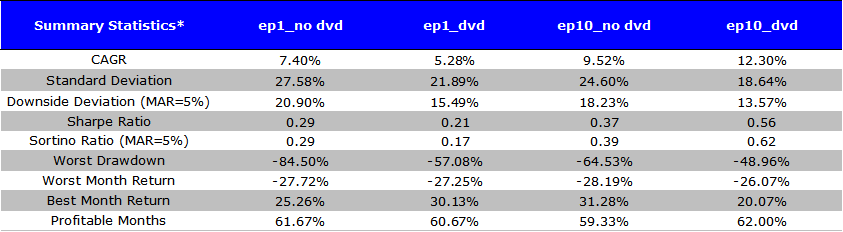
Here are the summary statistics for earnings yield:
- ep1_no dvd = E/P, decile 1, non payers
- ep1_dvd = E/P, decile 1, payers
- ep10_no dvd = E/P, decile 10, non payers
- ep10_dvd = E/P, decile 10, payers
But the next set of results muddy the water even further…
Consider the king of valuation metrics, EBIT/TEV, which is empirically the best-performing metric and one that we use in our own academic and practical work.
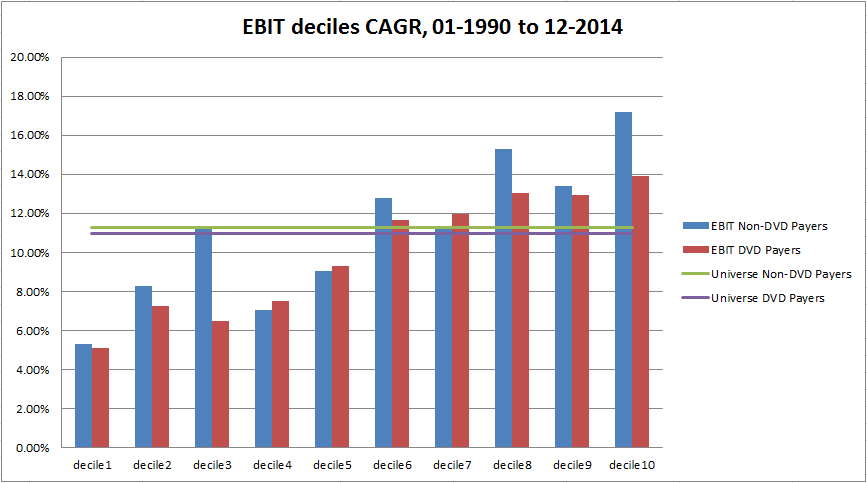
The results are hypothetical results and are NOT an indicator of future results and do NOT represent returns that any investor actually attained. Indexes are unmanaged, do not reflect management or trading fees, and one cannot invest directly in an index. Additional information regarding the construction of these results is available upon request.
The results using enterprise multiples suggest there is weak evidence that non-dividend payers actually drive the value anomaly, which is in direct contrast to the evidence using BM as a valuation metric.
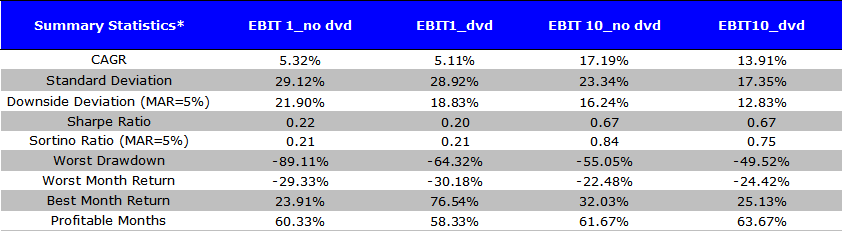
Here are the summary statistics for enterprise yield:
- EBIT1_no dvd = EBIT/TEV, decile 1, non payers
- EBIT1_dvd = EBIT/TEV, decile 1, payers
- EBIT10_no dvd = EBIT/TEV, decile 10, non payers
- EBIT10_dvd = EBIT/TEV, decile 10, payers
Conclusion
- BM is heavily influenced by payment classification and the evidence suggests that dividend payers drive the value anomaly.
- PE is weakly influenced by payment classification and the evidence weakly suggests that dividend payers drive the value anomaly.
- EBIT/TEV is weakly influenced by payment classification and the evidence weakly suggests that dividend non-payers drive the value anomaly.
There is no robust evidence to suggest that dividend paying classification drives the value anomaly in one direction or the other.
To learn about our philosophy on systematic value investing, click here

About the Author: Wesley Gray, PhD
—
Important Disclosures
For informational and educational purposes only and should not be construed as specific investment, accounting, legal, or tax advice. Certain information is deemed to be reliable, but its accuracy and completeness cannot be guaranteed. Third party information may become outdated or otherwise superseded without notice. Neither the Securities and Exchange Commission (SEC) nor any other federal or state agency has approved, determined the accuracy, or confirmed the adequacy of this article.
The views and opinions expressed herein are those of the author and do not necessarily reflect the views of Alpha Architect, its affiliates or its employees. Our full disclosures are available here. Definitions of common statistics used in our analysis are available here (towards the bottom).
Join thousands of other readers and subscribe to our blog.