Okay, we’re sold on a closet-indexing approach to the markets. Now we’re investigating a variety of smart-beta products available in the market that weigh a large portfolio of stocks with some algorithm. But a natural question arises when trying to pick smart beta ETFs:
What is the optimal method to weigh an index?
Everyone seems to have a story these days for the “best” way to weigh an index. In this study we look at simple ways to weigh a large-cap stock index using prices only. [1]
We enter 4 different weighting schemes in our asset allocation weight horse race:
- Equal-weight (EW): Each stock given a weight of 1/250.
- Momentum weight: Each stock’s momentum is measured over past 12 months. Momentum score (1+momentum) calculated for top 250 firms. The momentum weight is given by momentum score divided by sum of all momentum scores. Higher momentum score = higher weight.
- Volatility weight: Simple risk-parity technique applied to the top 250 firms, ignoring covariance between firms. The volatility weights constructed using the past 12-month idiosyncratic volatility of daily returns (regressed against the value weight market return). Higher volatility = lower weight (explained in detail below).
- Value-weight (VW): Calculated as market cap divided by total market cap of the top 250 largest firms.
Bottom-line up front: Low volatility worked the best on a risk-adjusted basis over the past 87 years. However, low volatility, was closely followed by momentum, equal-weighting, and value-weighting, respectively. Across the board, results are similar.
Let’s dig into the details on the different strategies we test in this study.
Asset Allocation Weight Approaches — List of the Strategies and Details
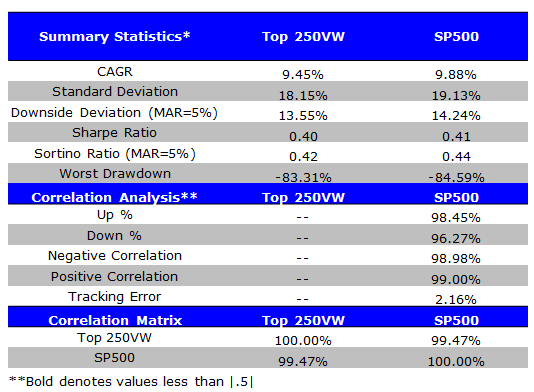
Universe: largest 250 domestic stocks every month (99.5% correlated w/S&P 500 from 1927-2014).
4 weighting schemes:
- Equal-weight (EW)
- Momentum weight
- Volatility weight (see below)
- Value-weight (VW)
Rebalance: monthly
Why use a 250 Stock Universe?
We use the top 250 stocks for the following reason:
- In the 1920s and 1930s, there were fewer stocks (around 500 total). We want to focus our results on larger firms, so we pick the top 250 stocks.
- Our goal is to identify a weighting scheme that works for a large pool of capital. We want to minimize the impact of poor liquidity and frictional costs, which can be substantial.
In the end, our choice of a 250 stock universe doesn’t matter that much:
- From 7/1/1927 – 12/31/2014, the value-weight returns to the top 250 stocks each month is 99.5% correlated with the S&P 500 returns (value-weight index). Summary statistics shown below:
The results are hypothetical results and are NOT an indicator of future results and do NOT represent returns that any investor actually attained. Indexes are unmanaged, do not reflect management or trading fees, and one cannot invest directly in an index. Additional information regarding the construction of these results is available upon request.
Asset Allocation Weighting Scheme Detail — Volatility Weight
To construct volatility weights, we estimate the volatility (σ_i ) of all available stocks (using data up to month t-1) and set the portfolio weight in asset class i to:
![]()
We estimate σ_(t,i ) as the 12-month idiosyncratic volatility of daily returns (regressed against the value weight market return). The number k_t is the same for all stocks and controls the amount of leverage of the volatility weighting portfolio. The unlevered volatility weights (we only study unlevered returns in this report) are obtained by setting:
![]()
This portfolio over-weights less volatile assets and under-weights more volatile assets.
Example: Let’s say that we have 3 stocks A, B, and C which each have volatilities 5%, 10%, and 20% respectively (this corresponds to σ above). Then,
![]()
![]()
So stock C, with the highest volatility, gets the lowest weight at 1/7; while stock A with the lowest volatility gets the highest weight at 4/7.
Core Results
- Results are gross, no fees are included
- All returns are total returns and include the reinvestment of distributions (e.g., dividends)
- Portfolios are rebalanced monthly
- Legend
- Top 250 EW = Equal-weighting the largest 250 firms
- Top 250 Vol = Volatility-weighting the largest 250 firms
- Top 250 Mom = Momentum-weighting the largest 250 firms
- Top 250 VW= Value-weighting the largest 250 firms
- SP500 = S&P 500 Total Return Index
Hypothetical performance results have many inherent limitations, some of which, but not all, are described in the disclosures at the end of this document. No representation is being made that any fund or account will or is likely to achieve profits or losses similar to those shown herein. In fact, there are frequently sharp differences between hypothetical performance results and the actual results subsequently realized by any particular trading program. Indexes are unmanaged, do not reflect management or trading fees, and one cannot invest directly in an index.
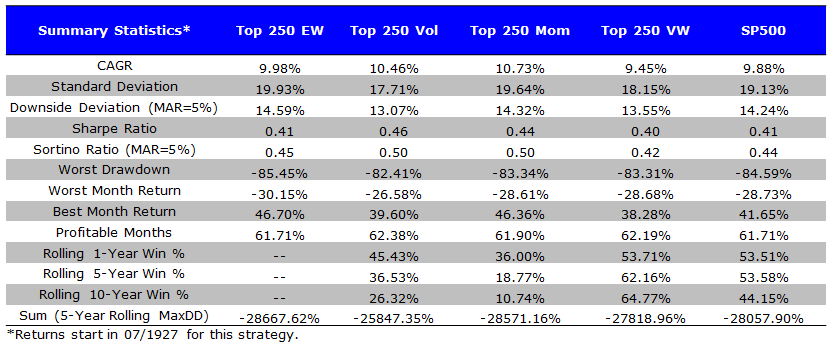
Monthly Rebalance — Full Sample: 7/1/1927 – 12/31/2014
- Over the entire time period, Volatility and Momentum weighting have the highest performance (CAGR, Sharpe, Sortino ratios).
- Equal-weighting, Volatility-weighting techniques and Momentum-weighting all beat the standard value-weighting technique.
The results are hypothetical results and are NOT an indicator of future results and do NOT represent returns that any investor actually attained. Indexes are unmanaged, do not reflect management or trading fees, and one cannot invest directly in an index. Additional information regarding the construction of these results is available upon request.
Monthly Rebalance — First Half: 7/1/1927 – 12/31/1971
- Over the first half of the sample, Volatility and Momentum weighting have the highest performance (CAGR, Sharpe, Sortino ratios).
- Equal-weighting, Volatility-weighting techniques and Momentum-weighting all beat the standard value-weighting technique.

The results are hypothetical results and are NOT an indicator of future results and do NOT represent returns that any investor actually attained. Indexes are unmanaged, do not reflect management or trading fees, and one cannot invest directly in an index. Additional information regarding the construction of these results is available upon request.
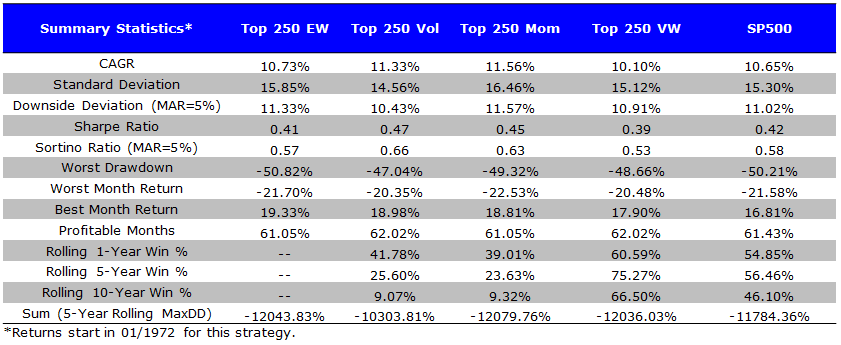
Monthly Rebalance — Second Half: 1/1/1972 – 12/31/2014
- Over the second half of the sample, Volatility and Momentum weighting have the highest performance (CAGR, Sharpe, Sortino ratios).
- Equal-weighting, Volatility-weighting techniques and Momentum-weighting all beat the standard value-weighting technique.
The results are hypothetical results and are NOT an indicator of future results and do NOT represent returns that any investor actually attained. Indexes are unmanaged, do not reflect management or trading fees, and one cannot invest directly in an index. Additional information regarding the construction of these results is available upon request.
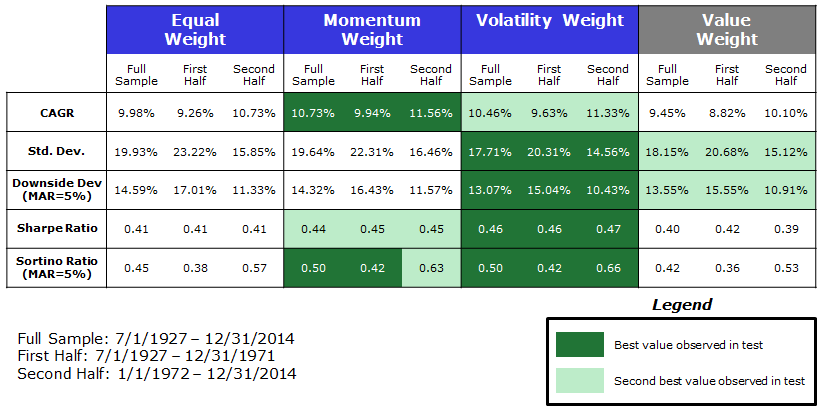
And the winner of our asset allocation weight horse race is…
- Volatility weighting has the highest Sharpe and Sortino Ratio in all periods and has the highest risk-adjusted returns.
- Momentum weighting has the highest CAGR in all periods, but follows volatility weighting on a risk-adjusted basis.
- Equal weighting works better than the value weight index, but the effect is marginal.
The results are hypothetical results and are NOT an indicator of future results and do NOT represent returns that any investor actually attained. Indexes are unmanaged, do not reflect management or trading fees, and one cannot invest directly in an index. Additional information regarding the construction of these results is available upon request.
Summary:
Our 3 alternative weighting techniques all have better CAGR, Sharpe and Sortino ratios, compared to the standard value-weighting technique. However, we must point out that investors must account for trading costs and taxes — a value weight index can minimize both. If an investor decides to use an alternative index weighting technique, they may want to consider using ETFs to accomplish this goal.
Endnotes:
1. We do not study fundamental stock weighting in this particular study (e.g., RAFI, we’ll share that research in the future).
About the Author: Jack Vogel, PhD
—
Important Disclosures
For informational and educational purposes only and should not be construed as specific investment, accounting, legal, or tax advice. Certain information is deemed to be reliable, but its accuracy and completeness cannot be guaranteed. Third party information may become outdated or otherwise superseded without notice. Neither the Securities and Exchange Commission (SEC) nor any other federal or state agency has approved, determined the accuracy, or confirmed the adequacy of this article.
The views and opinions expressed herein are those of the author and do not necessarily reflect the views of Alpha Architect, its affiliates or its employees. Our full disclosures are available here. Definitions of common statistics used in our analysis are available here (towards the bottom).
Join thousands of other readers and subscribe to our blog.