Psychology research suggests that when we make predictions, we suffer from “representative bias,” mistakenly overweight observations that fit a particular narrative, and fail to consider base rate probabilities. For example, if we flip a coin 5 times and it shows up H, H, H, H, H, we may assume that Hs is more likely, even though the probability is still 50/50. Consider a more tangible example associated with identifying a mutual fund. When reviewing a specific mutual fund’s performance, we may see several years of outperformance associated with a fund, and conclude that it will continue to outperform in the future, even though the evidence suggests that most active mutual funds are 1) closet-indexers and/or 2) have no skill, and their performance is highly mean-reverting. In other words, we overweight the recent performance that represents a “winner” and fail to account for the base rate probability that that chance of identifying a winner is very low. Our predictions for future outperformance are representative of the outperformance we have observed in the recent past, which is available and salient. Our prediction fits with the recent evidence but fails to account for the base rate evidence.
Anyone reading this blog post has probably seen the SEC disclaimer, “past performance does not necessarily predict future results” on fund documents. There are good reasons the SEC decided to require this language when it comes to performance discussions associated with past results. Regulators are pretty savvy. For instance, in “Timing Poorly: A Guide to Generating Poor Returns While Investing in Successful Strategies,” by Hsu, Myers, and Whitby, the authors find that investors “chase” performance, allocating to funds that have done well, and redeeming from funds that have done poorly. Put another way, investors think they can profitably time in and out of funds, based on recent fund performance. They are simply wrong about this, which gives rise to a “behavioral return gap,” representing the difference between the dollar-weighted returns investors actually receive, and the returns earned by buy-and-hold fund investors (we’ve discussed this “return gap” before, see here).
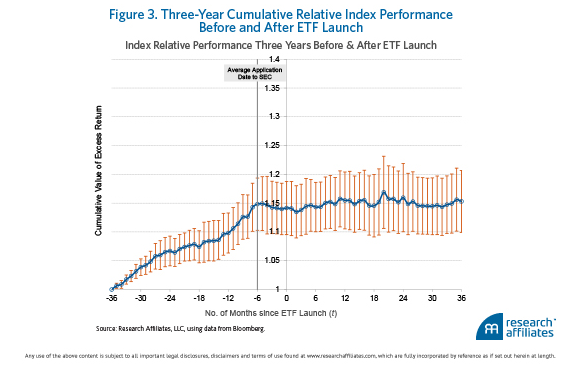
Investor preferences for the investing “hot hand” are not limited to mutual funds. Perhaps predictably, investors also look to the past and chase performance when evaluating new ETF launches. In “Chasing Performance with ETFs,” by Brightman, Li, and Liu, of Research Affiliates, the authors examine the performance of long-only U.S. ETFs launched between 1993 and 2014. They reviewed the relative performance (versus the Russell 3000 Index) of the underlying indexes associated with these ETFs across two time periods: 1) the 3-years leading up to the launch date, and 2) the 3-years subsequent to launch.
Below are the results:
What do you notice?
The indexes show strong performance leading up to the ETF launch (or more accurately, until 6 months before launch, when the decision to launch the ETF was probably made). Next, the evidence shows that on average, ETF performance subsequent to launch tends to be…average.
What are we to make of this finding? Two obvious possibilities come to mind.
The first interpretation is as follows: Maybe ETF providers are simply bad at identifying robust strategies. Think data mining run amok, with ETF providers looking at backtests and indexes and concluding that the performance leading up to the launch will represent future performance.
The second interpretation is more cynical: ETF providers are perfectly aware their strategies are nothing special, but they still don’t care. They know that prospective investors will love the past index performance and extrapolate the trend going forward. So what do the fund providers do? They throw spaghetti at the wall and see what sticks. If they launch a few strategies, and one gets lucky and subsequently outperforms, then more investors will chase performance and rush into that ETF; the ETF provider can recoup all their costs on the rest of the losers and make an overall profit. This is a well-documented approach in the mutual fund industry and there is a paper here by Rich Evans called, “Mutual Fund Incubation.” The approach is simple: launch a whole bunch of funds, by random luck a few will work, market the winners, rinse, repeat. Or in Prof. Evan’s words:
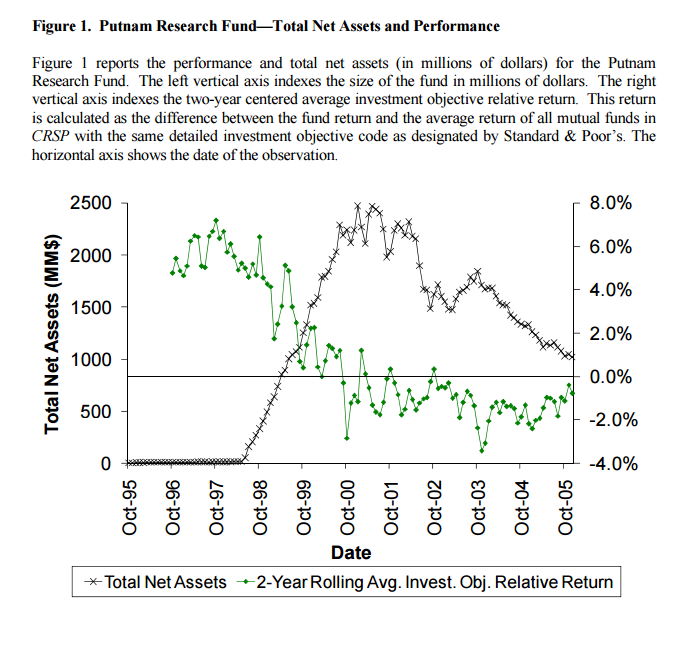
Incubation is a strategy for initiating new funds, where multiple funds are started privately, and, at the end of an evaluation period, some are opened to the public. Consistent with incubation being used by fund families to increase performance and attract flows, funds in incubation outperform non-incubated funds by 3.5% risk-adjusted, and when they are opened to the public, they attract higher net dollar flows. Post-incubation, however, this outperformance disappears.
The figure below, taken from Rich’s paper shows how this works. A fund is seeded with capital and allowed to build a track record. If the track record stinks, the fund is shut down, but if the track record is good, the fund will push it to the marketplace, which is filled with performance chasers. Assets balloon, performance mean reverts over time (it was never alpha, but an illusion), and the process is repeated. The fund complex wins, the investors lose, and the cycle of Wall Street life continues.
Throwing spaghetti at the wall and promising the moon is an obvious outcome in a market filled with investors focused on performance and not on process, but one can easily identify this approach in the marketplace: identify fund companies that continually launch and close funds every year and avoid them. And if one wants to ascertain whether a strategy has a chance of being sustainable, one needs to think through the Sustainable Active Investing Framework. In the end, for an active strategy to work, one needs to simultaneously identify 1) how the strategy can identify mispriced securities and 2) why other smart investors aren’t already taking advantage. That’s tough work, but it doesn’t end there. Next, the investor needs to see if after taxes and fees the benefit of the sustainable active strategy outweighs the costs. Also tough. But nobody ever said that active investing was a cakewalk.
About the Author: David Foulke
—
Important Disclosures
For informational and educational purposes only and should not be construed as specific investment, accounting, legal, or tax advice. Certain information is deemed to be reliable, but its accuracy and completeness cannot be guaranteed. Third party information may become outdated or otherwise superseded without notice. Neither the Securities and Exchange Commission (SEC) nor any other federal or state agency has approved, determined the accuracy, or confirmed the adequacy of this article.
The views and opinions expressed herein are those of the author and do not necessarily reflect the views of Alpha Architect, its affiliates or its employees. Our full disclosures are available here. Definitions of common statistics used in our analysis are available here (towards the bottom).
Join thousands of other readers and subscribe to our blog.