Here we are in August, a great time to drink–and think–about wine. Of course, as a research-focused finance blog, our angle on wine is a bit different than that of Dr. Vino.
A summary of the discussion:
…we estimate a real financial return to wine investment (net of storage costs) of 4.1%, which exceeds bonds, art, and stamps.
Get your attention?
Let’s dive right in, but grab a glass of wine before you start reading…
How do you construct your asset allocation mix?
Under the assumptions of modern portfolio theory, it is assumed that every additional asset added to a portfolio increases its diversification. Thus, in theory, investors should seek value-weight (i.e., market-cap weighted) exposure to every asset class available, in order to achieve the optimal portfolio along the so-called efficient frontier. So it makes sense to consider a wide variety of asset classes for investment.
Among alternative assets available for investment, some seek out so-called “treasure” assets, which includes things like art, antiques, or classic automobiles. Wine is also popular treasure asset. But is wine a good investment or just a good drink?
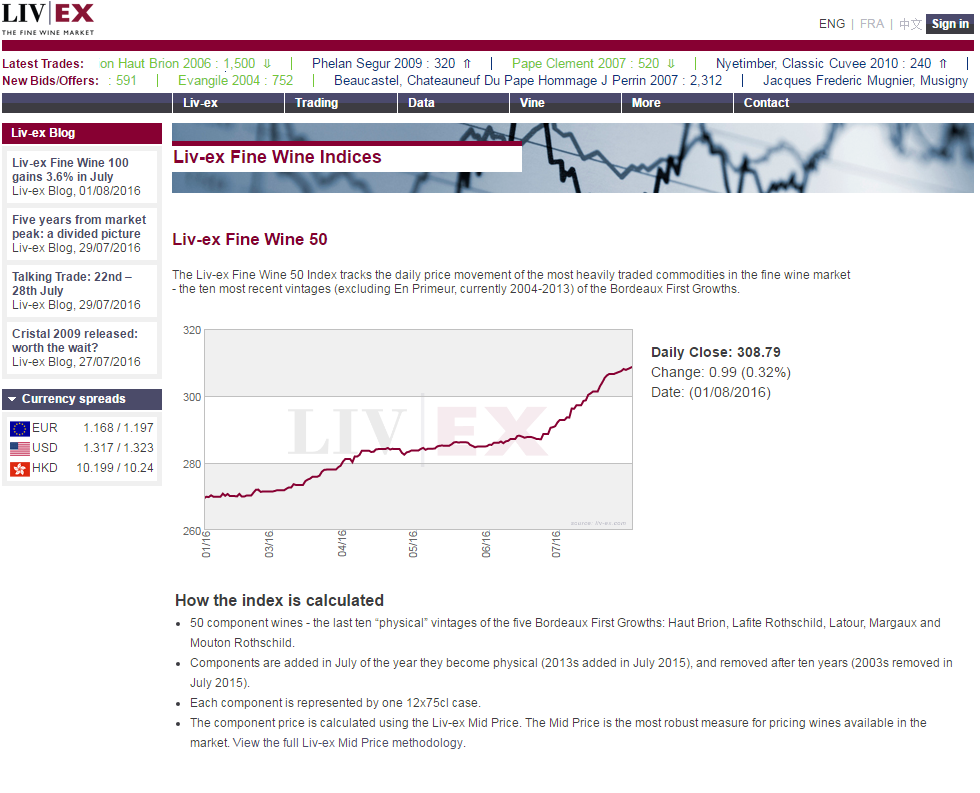
According to an american wine consumer survey, US wine sales were $38 billion in 2015, representing on the order of 10-15% of world industry revenues (depending on whose world estimates you believe). There is even a fine wine price tracking index called Livex. With scale and mainstream appeal, wine seems like a reasonable candidate for inclusion in a portfolio.
And investors do include a lot of wine in their portfolios. According to Ledbury Research, the following proportion of wealthy individuals owned treasure assets in these categories:
- Precious jewelry – 70%
- Fine art pictures & paintings – 49%
- Antique furniture – 37%
- Precious metals – 30%
- Wine collection – 28%
According to a Barclays research report, for those 28% of wealthy individuals who own wine, it represents approximately 2% of their wealth. And while people certainly invest in wine, it’s not obvious how this has worked out for them.
What have been the historical returns associated with investing in wines?
A recent paper by Dimson, Rousseau and Spaenjers (2016) sets out to answer this question by investigating the long-term price trends for wine.
Dimson et al. point out that the research on wine investing is limited in the literature and findings are mixed, and often dependent on the period being investigated. What distinguishes this research from prior efforts is that the authors use a much longer-term sample period, from 1900 to 2012, which allows for some interesting long-range comparisons versus equity and bond markets. Additionally, the authors explore how aging affects wines independent of market conditions, and after controlling for specific vintages (good and bad).
The two main questions explored in this paper are the following:
- What does the long-term performance look like for fine wine, compared to other asset classes?
- How does aging affect wine prices?
The authors study the prices for five kinds of Bordeaux wines: Haut-Brion, Lafite-Rothschild, Latour, Margaux, and Mouton-Rothschild. Two types of wine price data are used: auction hammer prices and retail list prices.
High-quality Wines vs. Low-quality Wines
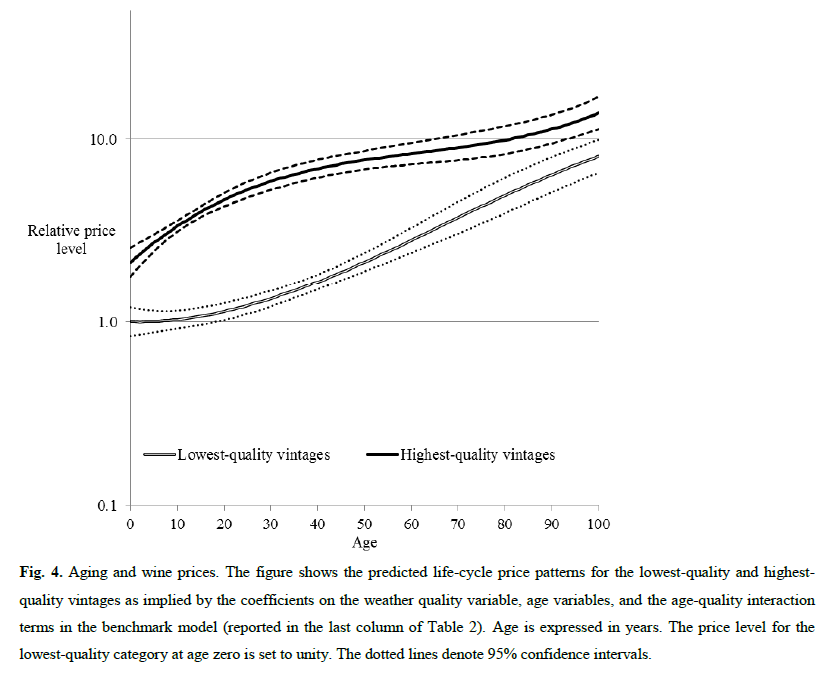
How do prices change over the life cycle of wine? Dimson et al. investigate this question by comparing prices of high-quality wines versus low-quality wines. There are three factors that affect a wine’s fundamental value: 1) the value of consumption today, 2) the present value of future consumption plus non-financial benefits of ownership, and 3) wine’s value as a collectible. These three factors are affected in different ways depending on whether a wine is high- or low-quality. Based on these differences, their price patterns are different. As the authors describe in the paper:
“High-quality vintages appreciate strongly while maturing for a few decades, but then prices stabilize until the wines become antiques, after which prices start rising again. For low-quality vintages, prices are almost flat over the first few years of the life cycle, but then rise in a near-linear fashion.”
The graph below depicts the price patterns of high- and low-quality wine over the life cycle (from year 0 to year 100). Overall, the non-financial payoff from the ownership of rare wine increases with age.
Long-term Performance of Wines
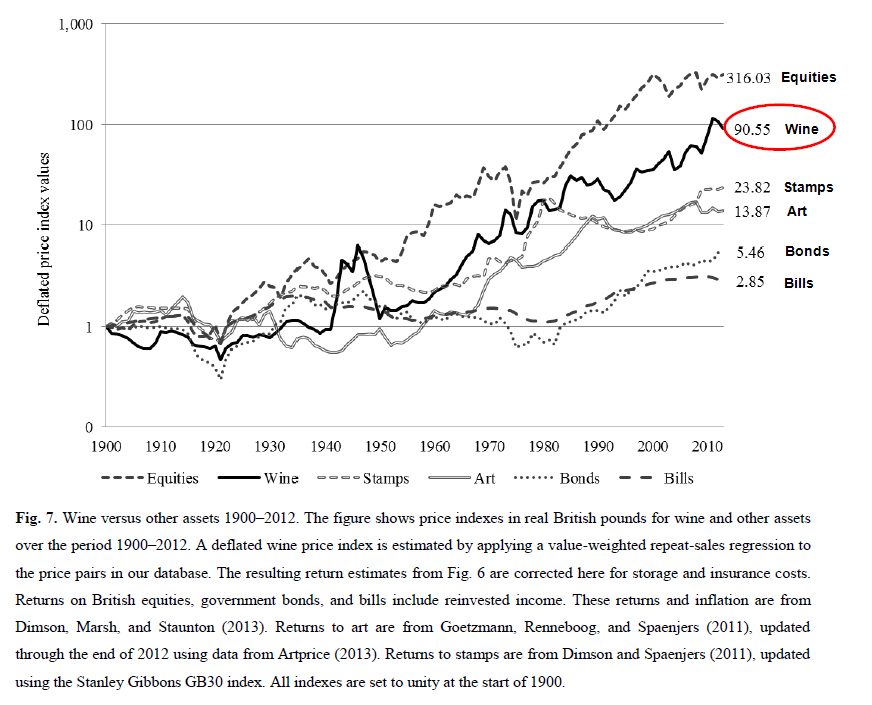
Next, the paper studies the past performance of wine investing from 1900 to 2012. Dimson et al. apply a value-weighted arithmetic repeat-sales regression to all price pairs in the sample. The authors find that the average annual real return for wine is 5.3%. After adjusting for the storage and insurance costs, the average annual real return is still 4.1%! Not bad. This compares favorably to real returns of 5.2% for equities over the sample period, although wine exhibits more price volatility.
The graph below plots the performance of wine versus other assets from 1900 to 2012. We can see wine outperforms bonds and bills, as well as other two kinds of “emotional assets” — art and stamps.
Conclusion
Wine seems to exhibit clear life cycle patterns, which are related to wine quality. Although wines have underperformed equities, they have outperformed other collectibles, such as art and stamps. Given today’s expensive equity and bond markets, perhaps the inclusion of wines in a portfolio makes good sense.
More reading
We had a summary of another good piece by Dimson and Spaenjers — investments in art, stamps, violins. Here’s the post if you are interested: Art, Stamps, and Violins in Your Portfolio?
The Price of Wine
- Dimson, Rousseau, and Spaenjers
- A version of the paper can be found here.
- Want a summary of academic papers with alpha? Check out our Academic Research Recap Category.
Abstract:
Using historical price records for Bordeaux Premiers Crus, we examine the impact of aging on wine prices and the long-term investment performance of fine wine. In line with the predictions of an illustrative model, young maturing wines from high-quality vintages provide the highest financial returns. Past maturity, famous châteaus deliver growing non-pecuniary benefits to their owners. Using an arithmetic repeat-sales regression over 1900–2012, we estimate a real financial return to wine investment (net of storage costs) of 4.1%, which exceeds bonds, art, and stamps. Returns to wine and equities are positively correlated. Finally, we find evidence of in-sample return predictability.
About the Author: David Foulke
—
Important Disclosures
For informational and educational purposes only and should not be construed as specific investment, accounting, legal, or tax advice. Certain information is deemed to be reliable, but its accuracy and completeness cannot be guaranteed. Third party information may become outdated or otherwise superseded without notice. Neither the Securities and Exchange Commission (SEC) nor any other federal or state agency has approved, determined the accuracy, or confirmed the adequacy of this article.
The views and opinions expressed herein are those of the author and do not necessarily reflect the views of Alpha Architect, its affiliates or its employees. Our full disclosures are available here. Definitions of common statistics used in our analysis are available here (towards the bottom).
Join thousands of other readers and subscribe to our blog.


