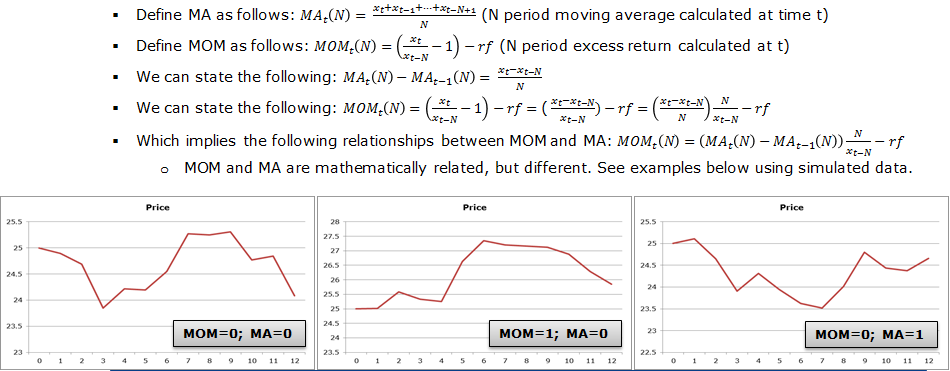
So you’re a trend-follower. Great.
But here is a question:
What do you invest in when your rules suggest “risk off?”
Many investors suggest low duration cash or t-bills. Seems reasonable.
But is it optimal?
Perhaps we should invest in longer duration risk-off assets like 10-yr bonds? We investigate these questions and come to the conclusion that keeping it simple is probably the best solution — dump “risk-off” assets into truly low risk assets like cash or t-bills.
A quick introduction to trend-following
Volatility, as measured in academia using standard deviation, is often synonymous with risk. Yet while volatility is an easily quantifiable number, it does have a number of drawbacks as a risk measure. One of the key assumptions in using volatility to define risk is that investors actually care about volatility. I take the view that this is only partially true. Volatility is a two-headed beast: Investors love volatile markets that move upwards but despise the value destruction of drawdowns. This duality presents the motivation for a tactical risk management overlay, which I’ll summarize into two key points:
- Capture the upside
- Limit the downside (reduce losses)
I say “reduce losses” recognizing that no strategy is perfect. But over the long run, some strategies can be effective at managing this dynamic. For example, the ten month simple moving average (SMA) strategy proposed by Faber1 and a twelve month time-series momentum strategy from Antonacci2 are two related methodologies that have been successful in the past. In both instances the authors have demonstrated the ability of these strategies to generate similar returns to that of a buy-and-hold strategy, but with substantially lower drawdowns. A prior post on this site combines both of these rules and argues that this approach creates an even more robust tail risk management approach. Nonetheless, when it comes to “market timing” constructs, nothing will ever work all the time and things that have worked in the past may never work in the future.
Although neither method is particularly complicated, the more straightforward of the two is the simple moving average strategy from Faber. It consists of the following two simple rules:
- Buy risk assets (stocks) when the monthly closing price is greater than the ten month simple moving average of their price.
- Sell stocks (and buy Treasury Bills) when the monthly closing price is below the ten month simple moving average of their price.
While the details of time-series momentum are slightly different, both of these methodologies are effectively absolute momentum strategies. They both seek to identify buy and sell signals based on recent past performance. A buy signal prompts an investor to purchase risk assets while a sell signal prescribes a move into a “risk-free” asset—typically Treasury Bills.
For the analysis below, I use a twelve month simple moving average (SMA) strategy based on the same two trading rules from Faber mentioned earlier. US Large Company Stocks represent the risk asset and 30 day Treasuries are the risk-free alternative. The below chart details the returns associated with Faber’s SMA strategy, as compared with a buy-and-hold strategy from 1927 through 2012:
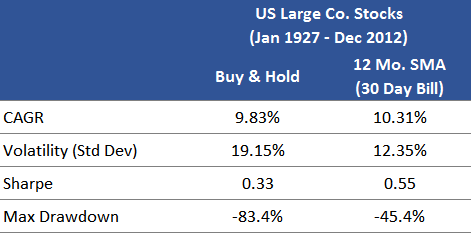
Source: Ibbotson3 The results are hypothetical results and are NOT an indicator of future results and do NOT represent returns that any investor actually attained. Indexes are unmanaged, do not reflect management or trading fees, and one cannot invest directly in an index. Additional information regarding the construction of these results is available upon request.
The results show that a simple moving average strategy, gross of transaction fees and taxes, actually outperformed the simple buy-and-hold investor over the 86 year period. How much did T-Bills contribute to the overall return versus the SMA strategy alone (i.e., using cash as the alternative asset)? One way to assess the impact is to rerun these numbers with a hypothetical zero return asset.
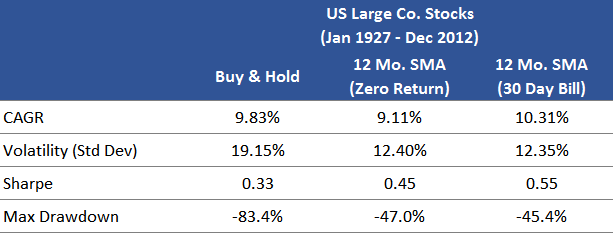
The results are hypothetical results and are NOT an indicator of future results and do NOT represent returns that any investor actually attained. Indexes are unmanaged, do not reflect management or trading fees, and one cannot invest directly in an index. Additional information regarding the construction of these results is available upon request.
The simple moving average strategy on its own reduced the rate of return from 9.83% to 9.11%. While the results look less attractive, they don’t exactly disqualify the use of a simple moving average strategy. They do, however, emphasize the importance of a risk-free alternative that provides some return. Adding Treasury Bills as the risk free alternative provided a slight boost of just over 1% (compared to the scenario with the zero-return asset). In other words the simple moving average strategy avoided large drawdowns in stocks, and simultaneously generated some additional return through exposure to Treasury Bills.
What Happens if we Change the “Risk-Off” Asset?
But let’s consider what happens when we move along the duration spectrum. What if Treasuries with a longer maturity were used as the alternative asset instead of Treasury Bills? A quick substitution for 5 year Treasury Notes and 20 year Treasury Bonds produced the following results:
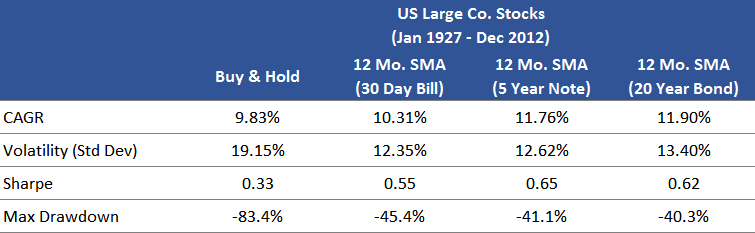
The results are hypothetical results and are NOT an indicator of future results and do NOT represent returns that any investor actually attained. Indexes are unmanaged, do not reflect management or trading fees, and one cannot invest directly in an index. Additional information regarding the construction of these results is available upon request.
On the surface, this would appear to be a spectacular finding—simply increasing the maturity of
Treasuries would have generated an even higher return and maintained lower drawdowns!
But I’m a little skeptical.
I can’t help but think there’s more to this story than meets the eye. Consider first the 1981 to 2012 period—more commonly referred to as the bond bull market.

The results are hypothetical results and are NOT an indicator of future results and do NOT represent returns that any investor actually attained. Indexes are unmanaged, do not reflect management or trading fees, and one cannot invest directly in an index. Additional information regarding the construction of these results is available upon request.
The theme of higher returns from increasing maturity looks even stronger, and this shouldn’t come as a surprise. During a falling interest rate environment yields will decrease and bond prices will rise. The resulting capital appreciation provided increasing rates of return to fixed income investors.
But what’s more interesting is what happens during a rising rate environment when yields increase and bond prices fall. Here we look at the results from 1965 to 1980.
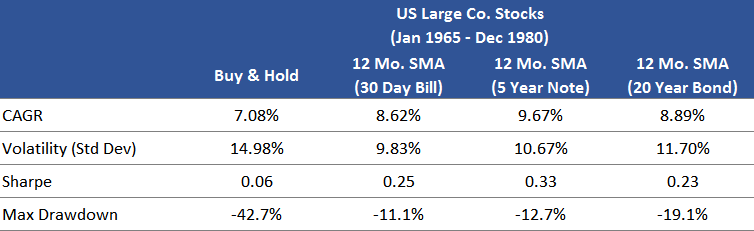
The results are hypothetical results and are NOT an indicator of future results and do NOT represent returns that any investor actually attained. Indexes are unmanaged, do not reflect management or trading fees, and one cannot invest directly in an index. Additional information regarding the construction of these results is available upon request.
We see that increasing the maturity of the alternative asset improved returns, but only to a certain point. The simple moving average strategy utilizing Treasury Bonds actually ended up performing worse than Notes, and with a substantially higher max drawdown compared to both Notes and Bills. Not scared yet? Consider the drawdowns that occurred on Treasuries:
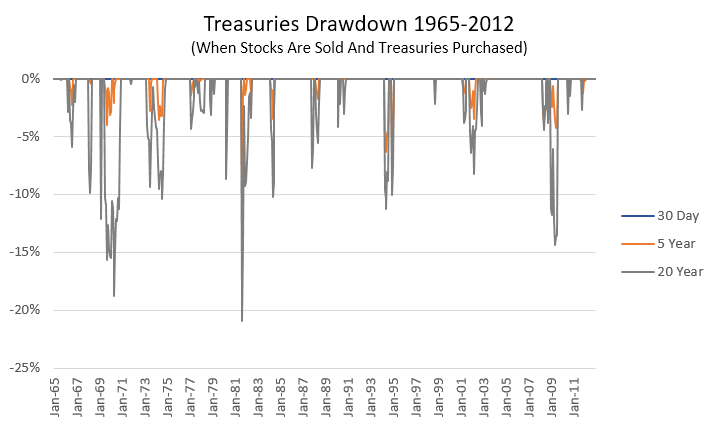
The results are hypothetical results and are NOT an indicator of future results and do NOT represent returns that any investor actually attained. Indexes are unmanaged, do not reflect management or trading fees, and one cannot invest directly in an index. Additional information regarding the construction of these results is available upon request.
The results above were filtered to show only the drawdowns on Treasuries when the SMA strategy dictated that Treasuries be held. The effect of stock drawdowns was eliminated to provide an apples-to-apples comparison. The tried and true short-term Treasury Bill held firm over the entire period while drawdowns on longer duration Notes and Bonds were significant.
Concluding points
This gets back to the idea of crisis alpha. It is often taken for granted that during times of distress, Treasuries will hold their value or even appreciate in price—everybody knows that Treasury bonds are “safe.” Bonds are an excellent diversifier, but history has shown that their perceived safety doesn’t always manifest, and in some cases the expected safety of Treasury Bonds may turn out to be dangerous. They can, and have, declined in price when panic sets in, especially during rising rate environments. With longer duration bonds, investors have greater exposure to changes in interest rates.
The conclusion here is fairly simple. An absolute momentum overlay can help reduce drawdowns. That’s what it’s intended to do. The alternative risk free asset may help provide a small amount of additional return gross of taxes and fees. Chasing higher rates of return by taking on interest rate risk may expose those using these strategies to further losses. The alternative risk free asset should be truly risk free, and that means sticking with the tried and true Treasury Bill.
References
- Faber, Mebane T. A Quantitative Approach to Tactical Asset Allocation. February 2013. http://papers.ssrn.com/sol3/papers.cfm?abstract_id=962461.
- Antonacci, Gary. Absolute Momentum: A Simple Rule-Based Strategy and Universal Trend-Following Overlay. April 2013. http://papers.ssrn.com/sol3/papers.cfm?abstract_id=2244633.
- 2013 Ibbotson SBBI Classic Yearbook. Morningstar Inc. Chicago, IL. 2013.
About the Author: Daniel Sotiroff
—
Important Disclosures
For informational and educational purposes only and should not be construed as specific investment, accounting, legal, or tax advice. Certain information is deemed to be reliable, but its accuracy and completeness cannot be guaranteed. Third party information may become outdated or otherwise superseded without notice. Neither the Securities and Exchange Commission (SEC) nor any other federal or state agency has approved, determined the accuracy, or confirmed the adequacy of this article.
The views and opinions expressed herein are those of the author and do not necessarily reflect the views of Alpha Architect, its affiliates or its employees. Our full disclosures are available here. Definitions of common statistics used in our analysis are available here (towards the bottom).
Join thousands of other readers and subscribe to our blog.