Value and Momentum investing have been studied across many different markets and asset classes (Asness et al 2013) and have shown to be effective factors. A working paper, “Frontier Stock Markets: Local vs Global Factors” by Douglas W. Blackburn and Nusret Cakici examines Value and Momentum investing in Frontier Markets from 2005-2016. This paper is unique because prior research has focused on out of sample value and momentum factor testing in emerging markets, but not in frontier markets. The caveat, of course, is the short sample period of just over 10 years.
The paper finds several things:
- Value and Momentum investing work in Frontier Markets, both in small and large firms.
- The 4-factor model (Market, Size, Value and Momentum) outperforms the single-factor model (Market) in explaining frontier market returns. More important however, is that the Local factors (Market, Size, Value and Momentum) explain returns better than Global Factors — this evidence suggests that frontier and global markets are segmented.
The portfolio construction and results
The paper’s goal is to examine how value and momentum investing (as well as size) work in frontier markets.
The standard factors are created using the frontier market data:
- SMB (Small minus Big) — Size factore formed on market capitalization
- HML (High minus Low) — Value factor formed on Book-to-Market (B/M)
- WML (Winners minus Losers) — Momentum factor formed on 12_2 momentum
The data used in the paper is from 2005-2016 and includes the following countries:
- Europe – Croatia, Estonia, Lithuania, Kazakhstan, Romania, Serbia, and Slovenia
- Africa – Kenya, Mauritius, Morocco, Nigeria, and Tunisia
- Middle East – Bahrain, Jordan, Kuwait, Lebanon, and Oman
- Asia – Bangladesh, Pakistan, Sri Lanka, and Vietnam
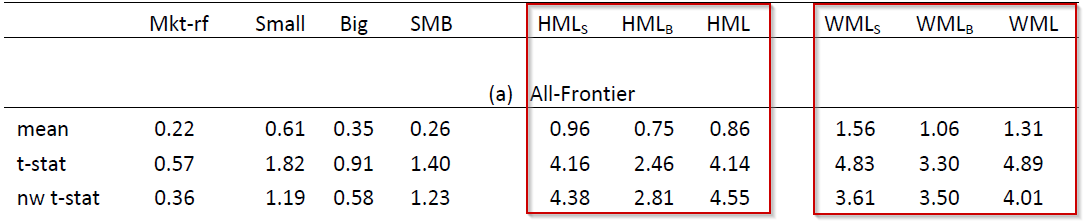
The paper examines the results to these 4 factors in Table 2 of the paper (Panel A shown below). From the table, there is not a significant size premium in Frontier markets (examining the SMB returns). However, both Value and Momentum investing factors work in Frontier Markets. The paper shows the results to the standalone factors (HML and WML), as well as the factors controlling for firm size. HML_S and HML_B refer to the HML returns within Small and Big firms respectively (same for WML). These results imply that value and momentum investing work both within small and large firms in frontier markets, as both factors are significant.
The results are hypothetical results and are NOT an indicator of future results and do NOT represent returns that any investor actually attained. Indexes are unmanaged, do not reflect management or trading fees, and one cannot invest directly in an index. Additional information regarding the construction of these results is available upon request.
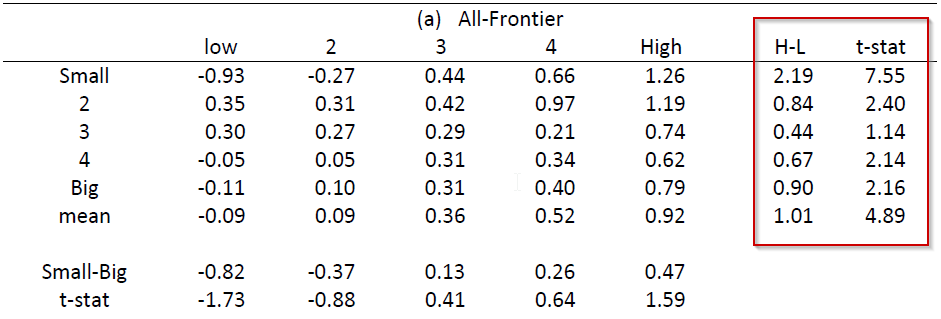
The paper shows the returns to 25 portfolios, split independently by size and either Value or Momentum.
The returns to the Value portfolios are found in Table 5 (Panel A shown below):
The results are hypothetical results and are NOT an indicator of future results and do NOT represent returns that any investor actually attained. Indexes are unmanaged, do not reflect management or trading fees, and one cannot invest directly in an index. Additional information regarding the construction of these results is available upon request.
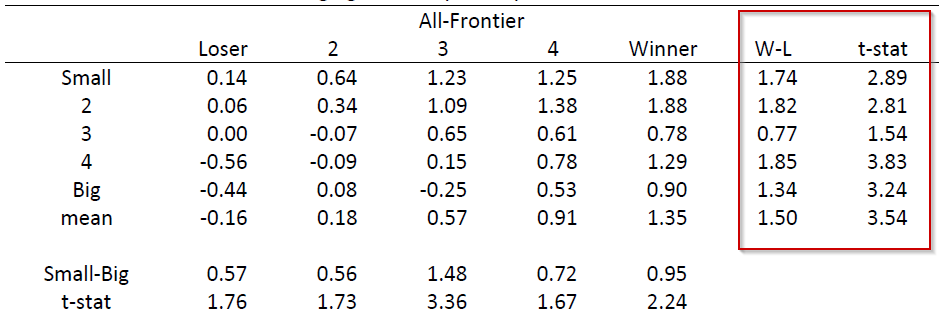
The returns to the Momentum portfolios are found in Table 6 (Panel A found below):
The results are hypothetical results and are NOT an indicator of future results and do NOT represent returns that any investor actually attained. Indexes are unmanaged, do not reflect management or trading fees, and one cannot invest directly in an index. Additional information regarding the construction of these results is available upon request.
The returns above from Tables 5 and 6 highlight that Value and Momentum investing appear to work across all size portfolios. It should be noted that value investing portfolio returns are the largest for smaller firms (similar to developed and emerging markets).
Next, the authors examine the explanatory power of adding the additional factors (SMB, HML, WML). The authors create the factors using both Local returns as well as Global returns. The results in Tables 7 and 8 regress 25 portfolios formed on size and B/M against the 1-factor, 3-factor, and 4-factor models (GRS test statistic is shown). Results from Table 7 (Panel A) are shown below:

The results are hypothetical results and are NOT an indicator of future results and do NOT represent returns that any investor actually attained. Indexes are unmanaged, do not reflect management or trading fees, and one cannot invest directly in an index. Additional information regarding the construction of these results is available upon request.
The results above show that adding additional factors (SMB, HML, WML) helps to explain the cross section of stock returns (seen through increasing R^2 and decreasing GRS test statistic). Additionally, the results (R^2 and GRS) of the Local Model and the Global Model indicate that the Local Factors are better at explaining the returns. This is important as it indicates that Frontier and Global markets are segmented (to some degree). More results on the correlations are found in Table 4 of the paper.
Overall, the paper finds that value and momentum investing work in Frontier markets! We are fans of combining value and momentum investing when forming portfolios. One caveat is that forming a long/short portfolio in Frontier markets may be difficult.
If anyone actively invests in frontier markets using value and momentum (especially in a long/short portfolio), feel free to add to the conversation.
Frontier Stock Markets: Local vs Global Factors
- Douglas W. Blackburn and Nusret Cakici
- A version of the paper can be found here.
Abstract:
We study the returns of stocks from twenty-one frontier markets divided into the four regions of Europe, Africa, Middle East and Asia from January 2006 to June 2016. Factor mimicking portfolios based on market capitalization (SMB), book-to-market equity (HML), and momentum (WML) are constructed and reveal large and significant returns associated with value and momentum in frontier markets. Different from the developed markets, value and momentum effects are observed in both large and small market cap stocks. Empirical asset pricing models are not able to explain the observed value and momentum return patterns. Local asset pricing models, which use factors constructed from frontier market returns, and global asset pricing models, which use factors derived from developed market returns, are rejected in nearly all cases; however, the local four-factor model strongly outperforms the local single-factor capital asset pricing model (CAPM) for all regions, and the local four-factor model is found to be vastly superior to all global models. Surprisingly, there is no difference in performance between the global one-factor CAPM and the global four-factor model in explaining frontier stock market returns. This evidence strongly suggests that frontier and developed markets are segmented.
About the Author: Jack Vogel, PhD
—
Important Disclosures
For informational and educational purposes only and should not be construed as specific investment, accounting, legal, or tax advice. Certain information is deemed to be reliable, but its accuracy and completeness cannot be guaranteed. Third party information may become outdated or otherwise superseded without notice. Neither the Securities and Exchange Commission (SEC) nor any other federal or state agency has approved, determined the accuracy, or confirmed the adequacy of this article.
The views and opinions expressed herein are those of the author and do not necessarily reflect the views of Alpha Architect, its affiliates or its employees. Our full disclosures are available here. Definitions of common statistics used in our analysis are available here (towards the bottom).
Join thousands of other readers and subscribe to our blog.