How to Combine Value and Momentum Investing Strategies
We are probably most well known for our quantitative value investing strategies. The heart of our strategy is detailed in Wes’ book, Quantitative Value (a reader’s digest version is here). In the development of the Quantitative Value system there is no mention of the concept of “momentum investing,” which is a well-established empirical anomaly in the academic finance literature and a topic we cover extensively on the blog. And don’t get us wrong, even though we are value-investing fans, we are also huge fans of momentum investing. We have a book on that subject as well (Quantitative Momentum)
But that begs a question that we have heard many times over via our readership:
Why don’t you include momentum in your value investing process?
This is a great question and one we will answer publicly for the first time.
Many are familiar with the evidence that value and momentum investment strategies have beaten the market, historically. And the low historical correlation between value and momentum suggests there is a benefit to combining these portfolios. So why don’t we include momentum in our value investing strategy?
Well, there are a few ways to skin the value and momentum cat:
- One solution is to combine the exposures as separate portfolios: part pure value; part pure momentum.
- Another solution is to “blend” the exposures into a single strategy: an integrated value and momentum system that weighs value and momentum factors and then holds firms with the highest combination.
As evidence-based investors, we decided early on to go with option #1. We aren’t suggesting that option #2 is a bad option, in fact, option #2 is a great solution relative to most security selection approaches peddled in the marketplace. We simply prefer option #1 because it is relatively better than option #2.
Why are pure value and momentum exposures better?
The evidence suggests that we keep highly active exposures to value and momentum in their purest forms (assuming we are doing high-conviction non-watered down versions of the anomalies). Blending the strategy dilutes the benefit of value and momentum portfolios. The summary of the benefits of a pure value and a pure momentum approach can be summarized as follows:
- Easier ex-post assessment
- E.g., if we mix and match value/momentum it is more difficult to identify the drivers of performance after the fact.
- Stronger portfolio diversification benefits.
- Pure value and pure momentum strategies have lower correlations than “blended” versions.
- Stronger expected performance.
- Running pure value and pure momentum in highly active forms generates higher expected performance than blended systems.
The Set-up
First, let’s set up the experiment. We will examine all firms above the NYSE 40th percentile for market-cap (currently around $1.8 billion) to avoid weird empirical effects associated with micro/small cap stocks. We will form the portfolios at a monthly frequency with the following 2 variables:
- Momentum = Total return over the past twelve months (ignoring the last month)
- Value = EBIT/(Total Enterprise Value)
We form the simple Value and Momentum portfolios as follows:
- EBIT VW = Highest decile of firms ranked on Value (EBIT/TEV). Portfolio is value-weighted.
- MOM VW = Highest decile of firms ranked on Momentum. Portfolio is value-weighted.
- Universe VW = Value-weight returns to the universe of firms.
- SP500 = S&P 500 Total return
Results are gross of management fees and transaction costs. All returns are total returns and include the reinvestment of distributions (e.g., dividends).
Here are the returns (7/1/1963-12/31/2013):
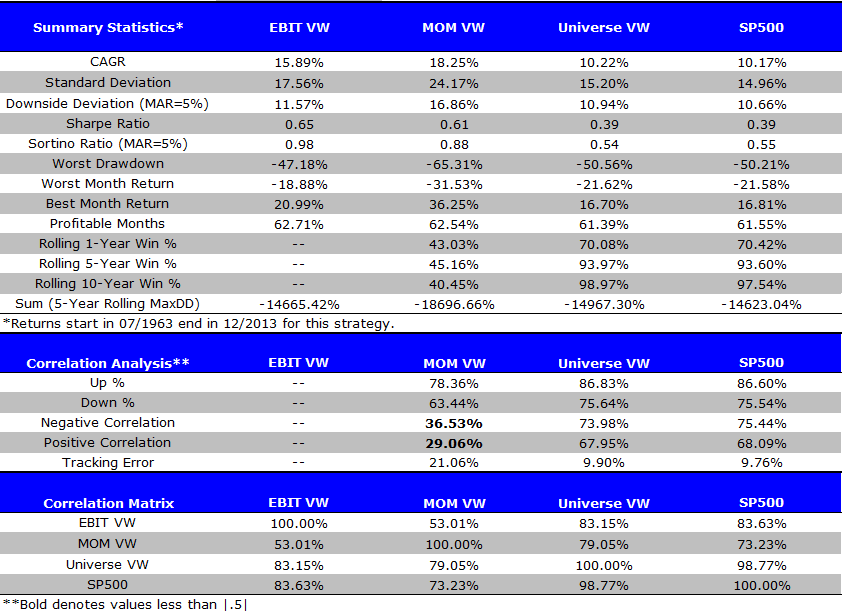
The results are hypothetical results and are NOT an indicator of future results and do NOT represent returns that any investor actually attained. Indexes are unmanaged, do not reflect management or trading fees, and one cannot invest directly in an index. Additional information regarding the construction of these results is available upon request.
Takeaways:
- The universe of stocks is similar to the SP500.
- The top decile of Value and Momentum outperformed the index over the past 50 years.
- There is a rather low correlation of 0.5301 between Value and Momentum.
- Momentum has stronger returns than value, but much higher volatility and drawdowns. On a risk-adjusted basis they are similar.
The Test: Blended Value and Momentum vs. Pure Value and Momentum
The low correlation between value and momentum suggests there is a benefit to combining these historically high-performing portfolios. There are a few ways in which an investor can attempt to exploit these anomalies:
- One solution is to combine them as seperate portfolios: part pure value; part pure momentum.
- Another solution is to “blend” the exposures into a single strategy: an integrated value and momentum system that weighs value and momentum factors and then holds firms with the highest combination.
To help us identify the best approach we set up a small experiment.
We form the following four portfolios:
- EBIT VW = Highest decile of firms ranked on Value (EBIT/TEV). Portfolio is value-weighted.
- MOM VW = Highest decile of firms ranked on Momentum. Portfolio is value-weighted.
- COMBO VW = Rank firms independently on both Value and Momentum. Add the two rankings together. Select the highest decile of firms ranked on the combined rankings. Portfolio is value-weighted.
- 50% EBIT/ 50% MOM VW = Each month, invest 50% in the EBIT VW portfolio, and 50% in the MOM VW portfolio. Portfolio is value-weighted.
Results are gross of management fees and transaction costs. All returns are total returns and include the reinvestment of distributions (e.g., dividends).
Here are the returns (7/1/1963-12/31/2013):
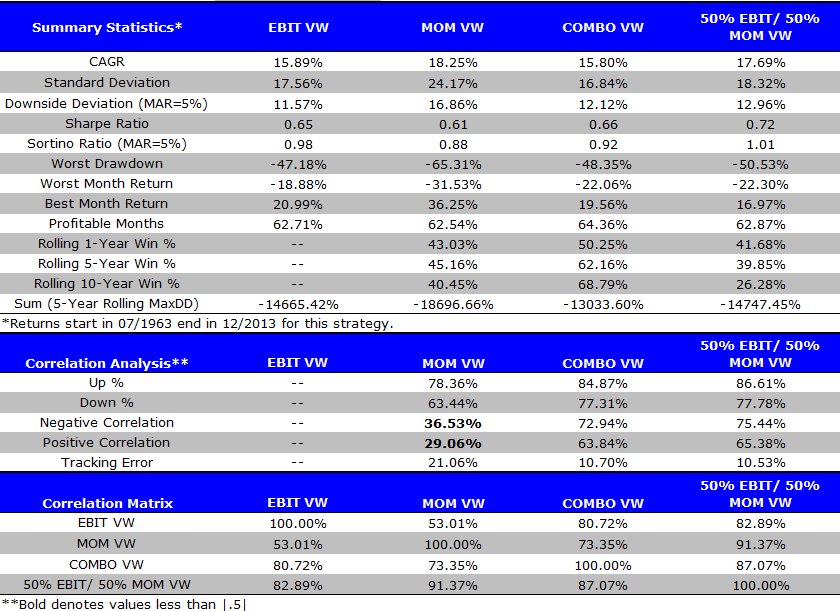
The results are hypothetical results and are NOT an indicator of future results and do NOT represent returns that any investor actually attained. Indexes are unmanaged, do not reflect management or trading fees, and one cannot invest directly in an index. Additional information regarding the construction of these results is available upon request.
Takeaways:
- The combination portfolio performs worse than a 50% allocation to Value and a 50% allocation to Momentum. This statement is driven by an analysis of CAGR, Sharpe and Sortino ratios.
- The combined ranked portfolio outperforms the index over the same time period–not a “bad” portfolio construct by any means.
- The 50% pure value and 50% pure momentum portfolio has the highest risk-adjusted returns across all portfolios.
- In addition, we find similar results when equal weighting portfolios.
Summary
Overall, the evidence suggests that a blended strategy, which combines Value and Momentum into a single unified process, is worse than allocating 50% of your capital to a pure value investing fund, and 50% to a pure momentum investing fund. This may have implications for how investors allocate to value and momentum anomalies. Of course, one must consider that we have only analyzed simple value and simple momentum strategies. Perhaps there are more sophisticated techniques to make “blended” val/mom better than allocations to pure value and momentum. Some evidence from other authors finds conflicting evidence. We’ve done our own extensive testing reconciling the various findings, and we think the analysis above highlights in a SIMPLE way that combo portfolios are relatively better than blended portfolios. That said, we are open to additional input and testing from the broader research community.
How to Combine Value and Momentum Investing Strategies (Part 2/2)
In the prior section I wrote about ways to combine value investing and momentum investing. The high level takeaway from that article was to keep value and momentum as separate exposures. This conclusion was based on ranking firms on their combined value and momentum rankings, which can be described as follows:
- Rank all stocks on value
- Rank all stocks on momentum
- Average the ranks
Here, I want to examine how sequential rankings affect returns. Sequential ranking can be described as follows:
- Rank all stocks on value
- Within value, rank on momentum
- Buy cheap stocks with the highest momentum
- Repeat steps 1-3 but start with momentum and then value (so you end up buying the highest momentum stocks that are the cheapest)
We find that sorting stocks on value and then momentum has been a historically successful strategy. However, sorting stocks on value and then quality, which is inline with a fundamental value philosophy, works just as well, if not better. We hypothesize that the “momentum” effect identified within the cheap stocks bucket, is really a proxy for strong fundamentals and positive operational momentum among the cheapest, highest quality value stocks. Our preference–based on empirical and philosophical grounds–is to go with a more “pure” value philosophy that focuses on buying the cheapest, highest quality value stocks, as opposed to a muddled value approach that buys the cheapest, highest momentum value stocks.
Value Investing Portfolio Set-up:
First, let’s set up the experiment. We will examine all non-financial firms above the NYSE 40th percentile for market-cap (currently around $1.8 billion) to avoid weird empirical effects associated with micro/small cap stocks. We will form the portfolios at a monthly frequency with the following 2 variables:
- Momentum = Total return over the past twelve months (ignoring the last month)
- Value = EBIT/(Total Enterprise Value)
The simple value investing portfolios are formed monthly as follows:
- EBIT Decile EW MR = Highest decile of firms ranked on Value (EBIT/TEV). Portfolio is equal-weighted and rebalanced monthly.
- EBIT (19/20) EW MR = Split the top decile ranked on Value in two. Keep the the 90%-95% cheapest firms (EBIT/TEV). Portfolio is equal-weighted and rebalanced monthly.
- EBIT (20/20) EW MR = Split the top decile ranked on Value in two. Keep the the 95%-100% cheapest firms (EBIT/TEV). Portfolio is equal-weighted and rebalanced monthly.
- SP500 EW = S&P 500 equal-weight Total return
Results are gross of management fees and transaction costs. All returns are total returns and include the reinvestment of distributions (e.g., dividends). Transaction costs at a monthly rebalance level could be substantial, but we leave it readers to make a determination on these costs because investors face vastly different trading cost regimes.
Here are the returns (1/1/1974-12/31/2014):
Value Investing Portfolio Results:
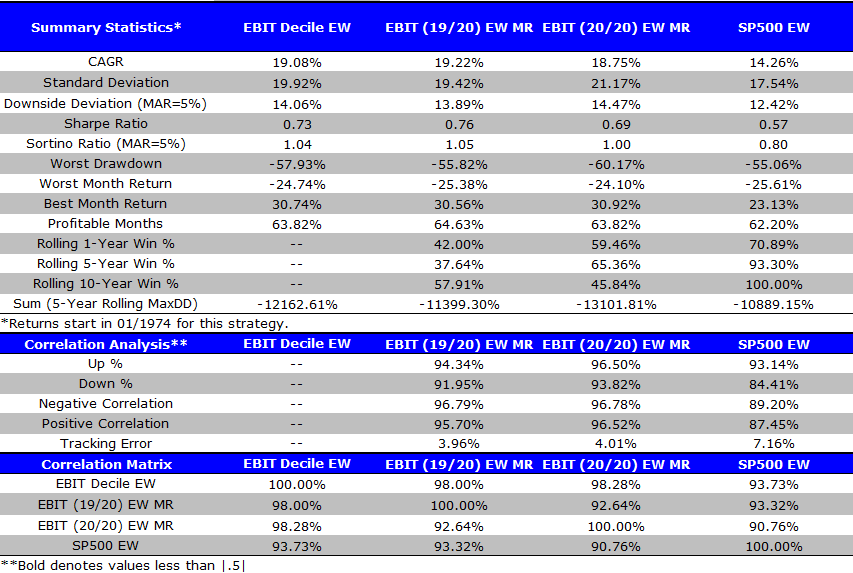
The results are hypothetical results and are NOT an indicator of future results and do NOT represent returns that any investor actually attained. Indexes are unmanaged, do not reflect management or trading fees, and one cannot invest directly in an index. Additional information regarding the construction of these results is available upon request.
Takeaways:
- Value investing has outperformed over the past 41 years.
- Breaking down the top decile into 5% buckets does not improve returns. Deep value works, but over-concentration in cheap stocks simply adds risk, but not return.
Next we turn our attention to momentum investing portfolios.
Momentum Investing Portfolios Set-up:
The simple Momentum Investing portfolios are formed monthly as follows:
- MOM Decile EW MR = Highest decile of firms ranked on Momentum. Portfolio is equal-weighted and rebalanced monthly.
- MOM (19/20) EW MR = Split the top decile ranked on Momentum in two. Keep the the 90%-95% highest Momentum firms. Portfolio is equal-weighted and rebalanced monthly.
- MOM (20/20) EW MR = Split the top decile ranked on Momentum in two. Keep the the 95%-100% highest Momentum firms. Portfolio is equal-weighted and rebalanced monthly.
- SP500 EW = S&P 500 equal-weight Total return
Results are gross of management fees and transaction costs. All returns are total returns and include the reinvestment of distributions (e.g., dividends). Transaction costs at a monthly rebalance level could be substantial, but we leave it readers to make a determination on these costs because investors face vastly different trading cost regimes.
Here are the returns (1/1/1974-12/31/2014):
Momentum Investing Portfolio Results:
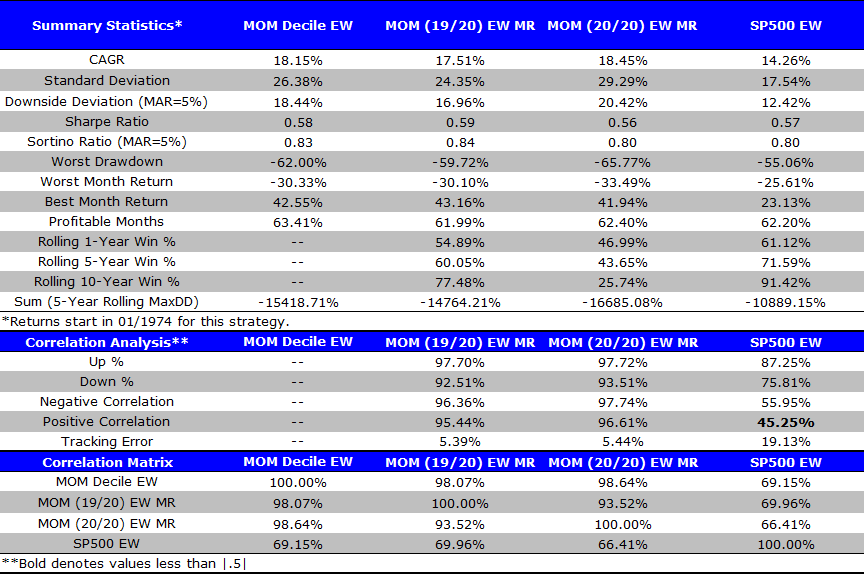
The results are hypothetical results and are NOT an indicator of future results and do NOT represent returns that any investor actually attained. Indexes are unmanaged, do not reflect management or trading fees, and one cannot invest directly in an index. Additional information regarding the construction of these results is available upon request.
Takeaways:
- Momentum investing has outperformed over the past 41 years.
- Buying the “highest” momentum stocks (top 5%) has marginal effects (higher CAGR, lower Sharpe ratios).
Combining Value and Momentum:
Here we want to combine Value and Momentum by sequentially sorting on the two variables.
Split the Momentum Decile by Value.
Specifically, here are the 4 portfolios we will examine:
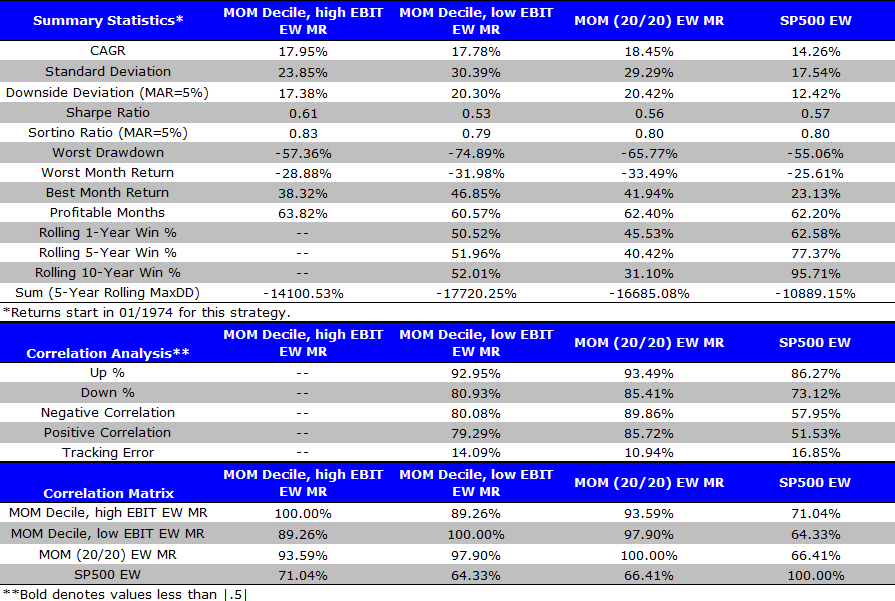
- MOM Decile, high EBIT EW MR = Highest decile of firms ranked on Momentum, then split on Value (EBIT/TEV). We keep the top half when sorted on Value. Portfolio is equal-weighted and rebalanced monthly.
- MOM Decile, low EBIT EW MR = Highest decile of firms ranked on Momentum, then split on Value (EBIT/TEV). We keep the bottom half when sorted on Value. Portfolio is equal-weighted and rebalanced monthly.
- MOM (20/20) EW MR = Split the top decile ranked on Momentum in two. Keep the the 95%-100% highest Momentum firms. Portfolio is equal-weighted and rebalanced monthly.
- SP500 EW = S&P 500 equal-weight Total return
Results are gross of management fees and transaction costs. All returns are total returns and include the reinvestment of distributions (e.g., dividends).
Here are the returns (1/1/1974-12/31/2014):
Momentum (and then Value) Investing Portfolio Results:
The results are hypothetical results and are NOT an indicator of future results and do NOT represent returns that any investor actually attained. Indexes are unmanaged, do not reflect management or trading fees, and one cannot invest directly in an index. Additional information regarding the construction of these results is available upon request.
Takeaways:
- Taking the top decile on Momentum and splitting on Value (EBIT/TEV) improves Sharpe and Sortino ratios (Comparing Column 1 to Columns 2 and 3).
- On a CAGR basis, the best bet is simply buying the top 5% of firm on Momentum.
Overall, this sequential sort (Momentum and then Value) does not drastically improve simple Momentum Investing returns.
Split the Value Decile by Momentum.
Specifically, here are the 4 portfolios we will examine:
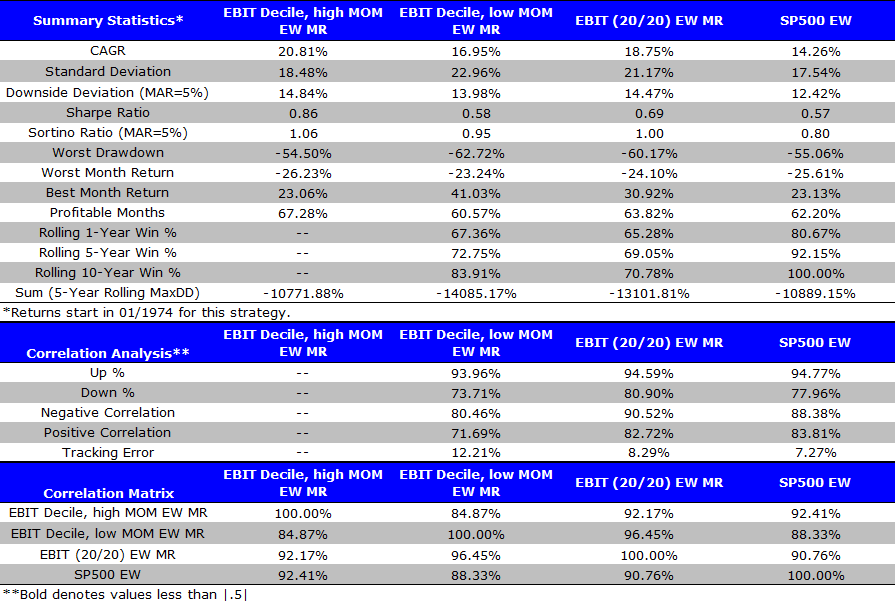
- EBIT Decile, high MOM EW MR = Highest decile of firms ranked on Value (EBIT/TEV), then split on Momentum. We keep the top half when sorted on Momentum. Portfolio is equal-weighted and rebalanced monthly.
- EBIT Decile, low MOM EW MR = Highest decile of firms ranked on Value (EBIT/TEV), then split on Momentum. We keep the bottom half when sorted on Momentum. Portfolio is equal-weighted and rebalanced monthly.
- EBIT (20/20) EW MR = Split the top decile ranked on Value (EBIT/TEV) in two. Keep the the 95%-100% cheapest firms. Portfolio is equal-weighted and rebalanced monthly.
- SP500 EW = S&P 500 equal-weight Total return
Results are gross of management fees and transaction costs. All returns are total returns and include the reinvestment of distributions (e.g., dividends).
Here are the returns (1/1/1974-12/31/2014):
Value (and then Momentum) Investing Portfolio Results:
The results are hypothetical results and are NOT an indicator of future results and do NOT represent returns that any investor actually attained. Indexes are unmanaged, do not reflect management or trading fees, and one cannot invest directly in an index. Additional information regarding the construction of these results is available upon request.
Takeaways:
- Taking the top decile of Value firms and splitting on Momentum improves returns in general. This improves the CAGR, Sharpe and Sortino ratios (Comparing Column 1 to Columns 2 and 3).
- Results are similar to other studies.
Overall, it appears that splitting Value by Momentum is a good strategy to follow!
However, such a strategy does require frequent rebalancing, as momentum works best if rebalanced more frequently. This will cause higher transaction costs relative to a long-term buy-and-hold Value strategy.
So an obvious question is the following — Why don’t we integrate momentum in to our Quantitative Value strategy?
The answer is simple: momentum doesn’t increase QV performance, in expectation.
Below, we explain why we do not incorporate momentum into our value algorithm.
Quantitative Value Index Universe Results:
Here we examine how splitting a Value portfolio by Momentum compares to the Quantitative Value results.
As explained here, the Quantitative Value process involves 5 steps. Step 4 requires us to sort firms based on their quality. However, what happens if we replace this step and sort firms by their past Momentum?
We answer this below. It is important to understand that the universe for the results above is slightly different than the results below, as the Quantitative Value process requires firms to have 8 years of data (which is not required above).
Specifically, here are the 4 (annually rebalanced) portfolios we will examine:
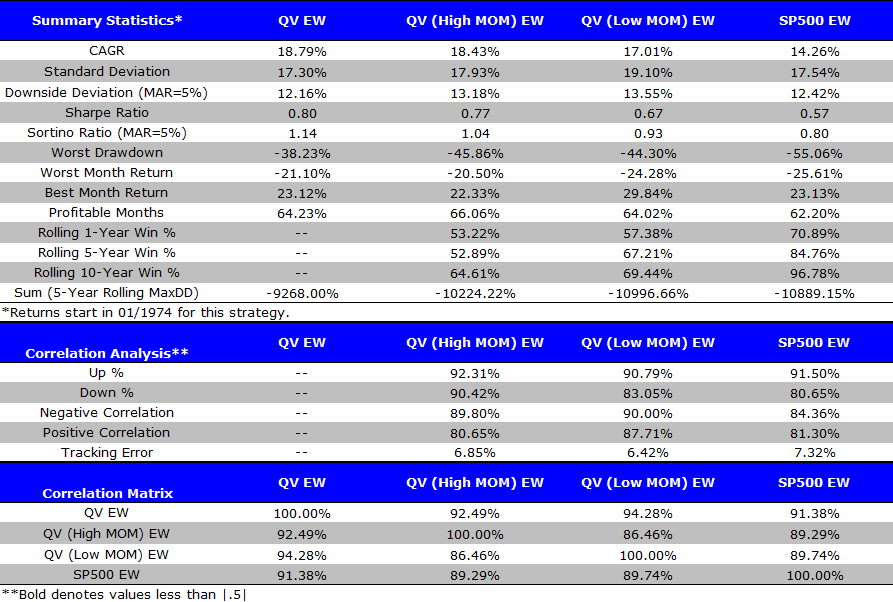
- QV EW = Portfolio formed using the Quantitative Value process. Portfolio is equal-weighted and rebalanced annually.
- QV (High MOM) EW = Portfolio formed using the first three steps of the Quantitative Value process. However, step 4 is changed to pick the top half of firms ranked on Momentum. Portfolio is equal-weighted and rebalanced annually.
- QV (Low MOM) EW = Portfolio formed using the first three steps of the Quantitative Value process. However, step 4 is changed to pick the bottom half of firms ranked on Momentum. portfolio is equal-weighted and rebalanced annually.
- SP500 EW = S&P 500 equal-weight Total return
Results are gross of management fees and transaction costs. All returns are total returns and include the reinvestment of distributions (e.g., dividends).
Here are the returns (1/1/1974-12/31/2014):
Quantitative Value Index Investing Portfolio Results (Annual Rebalance):
The results are hypothetical results and are NOT an indicator of future results and do NOT represent returns that any investor actually attained. Indexes are unmanaged, do not reflect management or trading fees, and one cannot invest directly in an index. Additional information regarding the construction of these results is available upon request.
Takeaways:
- Similar to the results above, splitting the top 10% Value firms by Momentum is a good strategy (Comparing Column 2 to Column 3).
- However, splitting firms by quality and keeping the top half (QV EW) is optimal when comparing CAGRs, Sharpe and Sortino ratios.
- These portfolios are highly correlated.
However, since we know Momentum works best at a monthly rebalance frequency, let’s examine the same portfolios which are rebalanced monthly.
Specifically, here are the 4 (monthly rebalanced) portfolios we will examine:
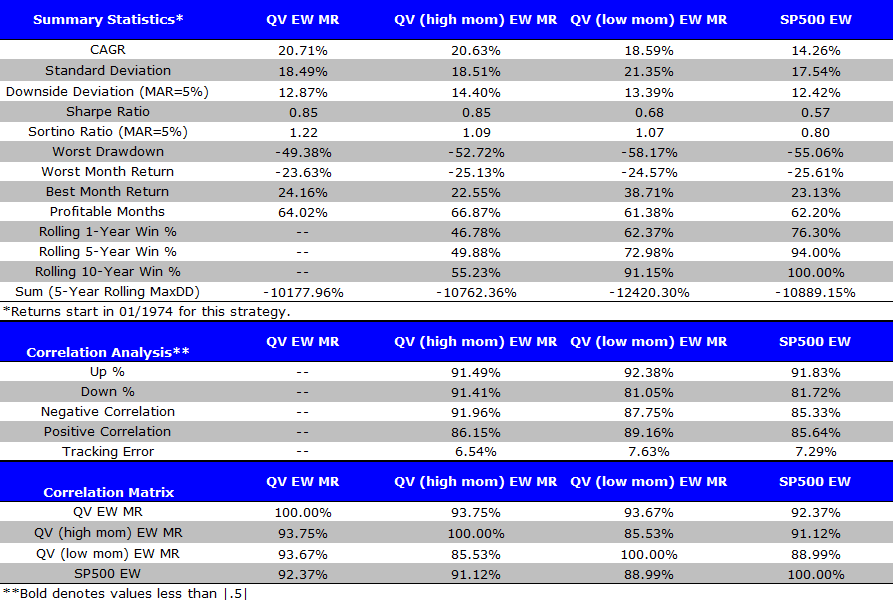
- QV EW MR = Portfolio formed using the Quantitative Value process. Portfolio is equal-weighted and rebalanced monthly.
- QV (High MOM) EW MR = Portfolio formed using the first three steps of the Quantitative Value process. However, step 4 is changed to pick the top half of firms ranked on Momentum. Portfolio is equal-weighted and rebalanced monthly.
- QV (Low MOM) EW MR = Portfolio formed using the first three steps of the Quantitative Value process. However, step 4 is changed to pick the bottom half of firms ranked on Momentum. portfolio is equal-weighted and rebalanced monthly.
- SP500 EW = S&P 500 equal-weight Total return
Results are gross of management fees and transaction costs. All returns are total returns and include the reinvestment of distributions (e.g., dividends).
Here are the returns (1/1/1974-12/31/2014):
Quantitative Value Index Investing Portfolio Results (Monthly Rebalance):
The results are hypothetical results and are NOT an indicator of future results and do NOT represent returns that any investor actually attained. Indexes are unmanaged, do not reflect management or trading fees, and one cannot invest directly in an index. Additional information regarding the construction of these results is available upon request.
Takeaways:
- Rebalancing the Value portfolios monthly increases returns. This has been found in other studies. However, this should increase trading costs (which are not included here), and does increase drawdowns.
- Similar to the results above, splitting the top 10% Value firms by Momentum is a good strategy (Comparing Column 2 to Column 3).
- However, splitting firms by quality and keeping the top half (QV EW MR) is optimal when comparing CAGRs, Sharpe and Sortino ratios.
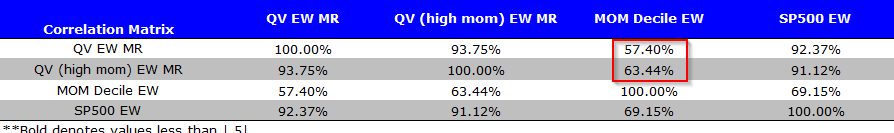
The last reason we prefer the QV strategy is shown in the table below:
The results are hypothetical results and are NOT an indicator of future results and do NOT represent returns that any investor actually attained. Indexes are unmanaged, do not reflect management or trading fees, and one cannot invest directly in an index. Additional information regarding the construction of these results is available upon request.
As is shown in the table, the correlation between QV and a generic Momentum portfolio is 57.40%, while the cheap firms split by Momentum have a slightly higher correlation (63.44%). All else being equal, we would prefer to have a lower correlation to Momentum.
Summary
In this article we set out to decide how combining Value and Momentum screens work when using them sequentially. First off, we find that splitting a Momentum portfolio by a Value screen does not appear to add value. However, splitting a Value portfolio by Momentum does add value. So why do we not incorporate this into our Quantitative Value strategy? We show above that splitting Value firms by their Quality score (as outlined in the Quantitative Value book) achieves the highest CAGR and risk-adjusted returns (Sharpe and Sortino ratios). This strategy also has a lower correlation to a simple Momentum strategy. Why would this work? Perhaps investors overlook the quality component of the firm (the quality score may also pick up operational momentum).
One word of caution for all the above results. These are shown gross of fees and transaction costs to facilitate comparison across strategies. Clearly, transaction costs will matter on these highly active strategies (momentum in particular). One could even argue that after transaction costs and complexity these strategies no longer add value. Additionally, one must consider the consequences that taxes may have on their portfolio. Caveats aside, the results are still interesting and should be considered by professional investors focused on evidence-based investment strategies.
About the Author: Jack Vogel, PhD
—
Important Disclosures
For informational and educational purposes only and should not be construed as specific investment, accounting, legal, or tax advice. Certain information is deemed to be reliable, but its accuracy and completeness cannot be guaranteed. Third party information may become outdated or otherwise superseded without notice. Neither the Securities and Exchange Commission (SEC) nor any other federal or state agency has approved, determined the accuracy, or confirmed the adequacy of this article.
The views and opinions expressed herein are those of the author and do not necessarily reflect the views of Alpha Architect, its affiliates or its employees. Our full disclosures are available here. Definitions of common statistics used in our analysis are available here (towards the bottom).
Join thousands of other readers and subscribe to our blog.