Why do CEOs decide to pay dividends?
That is an interesting question, and one that academics have been researching for years. Miller and Modigiliani in 1961 show that if one assumes perfect and efficient capital markets, and investors should have no preference as to whether or not a firm pays dividends.(1)(2)
However, (some) people care about dividends!
But are dividend paying stocks better investments? We show (along with other research papers and books) that examining more comprehensive measures of shareholder yield–such as the combination of dividends, net share repurchases, and net debt paydown–is more predictive of future returns.(3) And yet, against the evidence, many investors still ask — “What is the dividend yield?”
And so maybe there is a human psychology component involved here!
A paper in 2004 by Malcolm Baker and Jeffrey Wurgler examines this question. They ask the following — do companies “cater” to investor demands for dividends? To test this idea, they examine 4 stock price-based measures of investor demand for dividend payers. They find the following:
- When there is a high demand for dividends — non-payers tend to initiate dividends
- When there is a low demand for dividends — payers tend to omit dividends.
So the paper finds that CEOs appear to be “catering” to investor demands (follow on research shows that fund managers engage in “juicing” their dividends). However, one can argue that the measures used in the paper may not truly capture the “demand” for dividends.(4)
So what is a better way to measure the “demand” for dividends?
A new working paper, titled “A Direct Test of the Dividend Catering Hypothesis” written by Alok Kumar, Zicheng Lei, and Chendi Zhang tries to test this idea using a different data source — Google searches!
Summary of the New Dividend Catering Paper
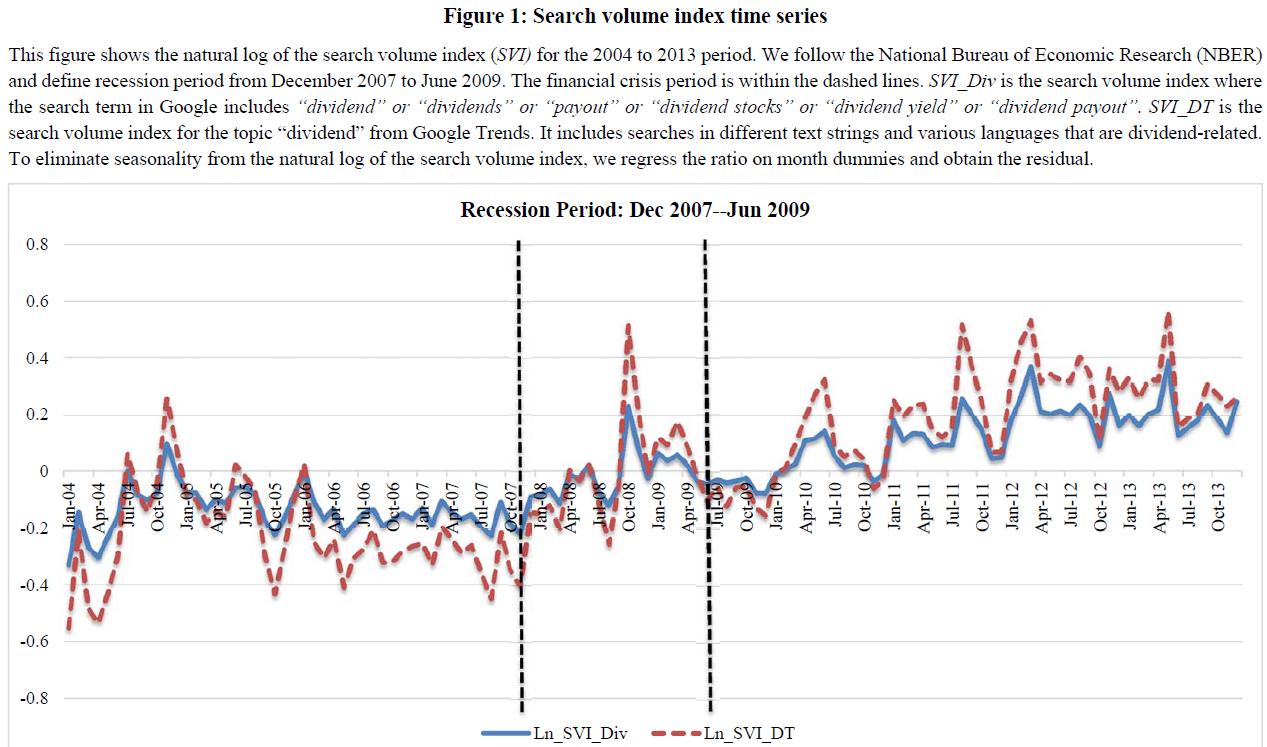
The authors use a new data source, search volume index (SVI), as a way to measure the “dividend sentiment” for U.S. investors. Here is an excerpt from the paper which describes the measure:
Google Trends provides top searches that are most frequently searched with the term we enter (for instance, “dividend”) in the same search session within the chosen category, country, or region. We then identify dividend-related searches with available data and construct a keyword-based index SVI_Div, to capture investors’ dividend sentiment (Da, Engelberg, and Gao, 2011, 2015). SVI_Div is the search volume index if the search term in Google Trends includes “dividend” or “dividends” or “payout” or “dividend stocks” or “dividend yield” or “dividend payout”. We also use SVI_DT as an alternative measure of dividend sentiment. SVI_DT is the search volume index for the topic “dividend” from Google Trends and includes searches in different languages and various text strings that are dividend-related.
Figure 1 of the paper provides an image of the time-series of the search for dividends.
The results are hypothetical results and are NOT an indicator of future results and do NOT represent returns that any investor actually attained. Indexes are unmanaged, do not reflect management or trading fees, and one cannot invest directly in an index. Additional information regarding the construction of these results is available upon request.
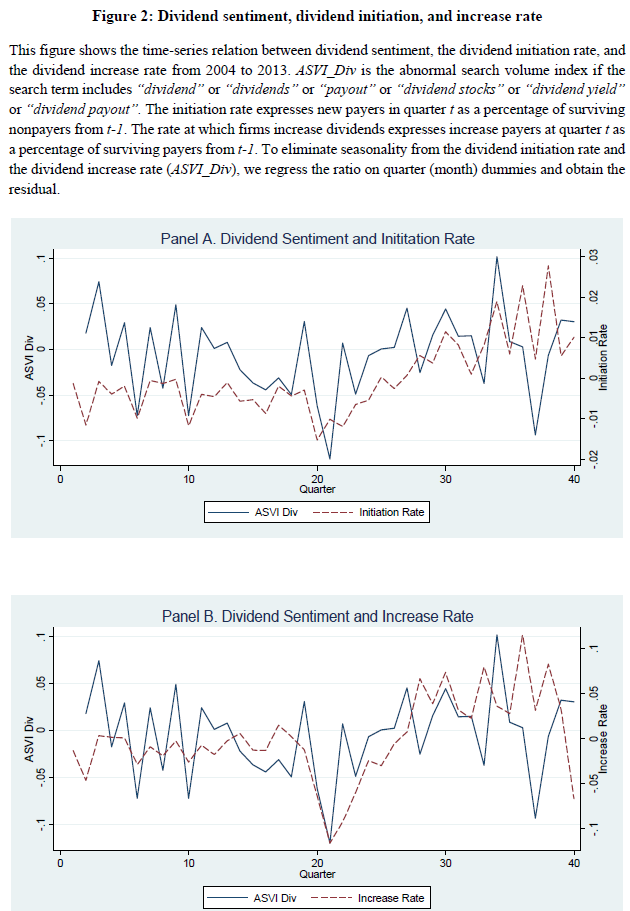
The paper then examines how this measure relates to (1) dividend initiation and (2) dividend increase rates. If managers are “catering” to investor demands, one may expect firms to initiate and increase dividend payment plans when investors are “demanding” dividends. Figure 2 of the paper (shown below) simultaneously graphs investor demand alongside (1) initiation rate and (2) dividend increase rate.
The results are hypothetical results and are NOT an indicator of future results and do NOT represent returns that any investor actually attained. Indexes are unmanaged, do not reflect management or trading fees, and one cannot invest directly in an index. Additional information regarding the construction of these results is available upon request.
As one can view from the image, there appears to be a relationship! The authors formally test the relationship via regressions and find (Table 3 in the paper) the following:
- There is a significant positive relationship between the dividend sentiment measure and dividend initiations.
- There is a significant positive relationship between the dividend sentiment measure and dividend increases.
The authors find that the two relationships above hold after controlling for a variety of measures. In addition, the authors find that the dividend catering occurs (and is stronger) in states where there is higher dividend sentiment (Table 6 of the paper).
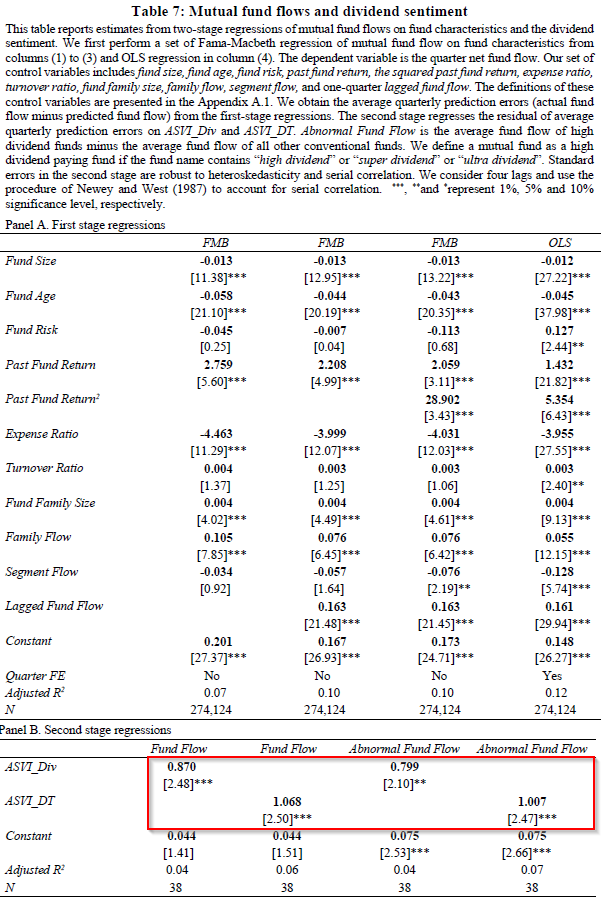
Next, the authors examine an interesting question — Does this affect fund flows?
The authors test this by examining the flow of assets into mutual funds that are classified as a “high dividend fund.” The results shown in Table 7 highlight that when dividend sentiment is high, investors tend to send more money into “high dividend funds.” A one standard deviation increase in the dividend sentiment variable leads to a 3.9% increase in the fund flows among the high dividend funds!
The results are hypothetical results and are NOT an indicator of future results and do NOT represent returns that any investor actually attained. Indexes are unmanaged, do not reflect management or trading fees, and one cannot invest directly in an index. Additional information regarding the construction of these results is available upon request.
Conclusion
So while there is evidence that investors should focus on more complete measures of shareholder yield, many investors still care about one thing — dividends!
This paper uses a new data source, Google searches, to test the theory that CEOs cater to investor demand for dividends. Similar to prior research using price-based measures, it appears that CEOs “cater” to investors’ dividend demands!
Should CEOs care about investor dividend demands? Please let us know what you think!
A Direct Test of the Dividend Catering Hypothesis
- Alok Kumar, Zicheng Lei, and Chendi Zhang
- Paper
Abstract
This paper uses a direct measure of investors’ time-varying preference for dividends to test the dividend catering hypothesis proposed in Baker and Wurgler (2004a, 2004b). Specifically, we use Internet search volume for dividend-related keywords as a direct measure of investor preference for dividends (i.e., dividend sentiment). We validate this measure by showing that mutual funds that pay high dividends receive more inflows when the dividend sentiment is stronger. Further, we find that firms initiate or increase dividends when the dividend sentiment is stronger. These effects are concentrated among firms located in states with high dividend sentiment. Differences in risk or other firm characteristics do not explain our findings. Collectively, these results provide support for the catering theory and show that managers cater to investors’ time-varying demand for dividends.
References[+]
| ↑1 | Note Miller and Mogidiliani also state that capital structure is irrelevant in other papers. |
|---|---|
| ↑2 | Some corporate finance literature tends to highlight that higher dividend payments reduce the CEO’s ability to spend capital on wasteful R&D projects. |
| ↑3 | Stocks with higher shareholder yield performed better than those with lower shareholder yield in the past. |
| ↑4 | Formally, they are the following: M/B, CU stock discount, abnormal announcement returns around initiations, and the difference of future stock returns between the VW portfolio of dividend paying firms and non-dividend paying firms. |
About the Author: Jack Vogel, PhD
—
Important Disclosures
For informational and educational purposes only and should not be construed as specific investment, accounting, legal, or tax advice. Certain information is deemed to be reliable, but its accuracy and completeness cannot be guaranteed. Third party information may become outdated or otherwise superseded without notice. Neither the Securities and Exchange Commission (SEC) nor any other federal or state agency has approved, determined the accuracy, or confirmed the adequacy of this article.
The views and opinions expressed herein are those of the author and do not necessarily reflect the views of Alpha Architect, its affiliates or its employees. Our full disclosures are available here. Definitions of common statistics used in our analysis are available here (towards the bottom).
Join thousands of other readers and subscribe to our blog.