The market has recently experienced record low levels of realized volatility and the VIX™ (volatility index) has fallen to historic lows. Moreover, the incredibly popular FAAMG stocks(1) have realized tremendous gains – more than tripling the broader market’s 8% return year-to-date. This market activity has been entertaining and many have likened it to the tech bubble of the late 1990s.(2)
Euphoria may be once again taking hold of markets – albeit not necessarily concentrated in specific sectors (e.g., technology or housing). Instead, it seems investors are falling in love with the entire market. The danger this time may stem from so many investors crowding into particular investment products and strategies. Indeed, I believe some of the most popular strategies are creating self-perpetuating flows of capital and significant risk (see here for a recent article on Chris Cole who shares similar views). In my view, the current levels of low volatility and astounding FAAMG performance are just symptoms of a potentially dysfunctional market whereby product mechanics have temporarily displaced investment due diligence and resulted is widespread malinvestment.
An outline of my self-perpetuating cycle hypothesis is outlined in the figure below:
Figure 1: Self-perpetuating Cycle?
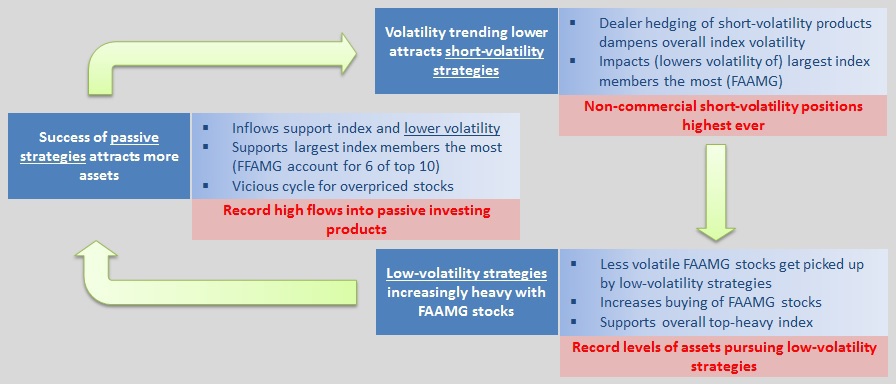
Source: Aaron Brask Capital
Passive Investing
Passive investing has become very popular due to the higher fees and lower performance of active investing (on average). It is worth noting, however, that passive investing is price-insensitive and thus depends on active investors to keep markets honest. Moreover, as more cash flows into index products, overpriced stocks attract more of those dollars and are at risk of systematically being further overpriced. Suffice to say, the historical success of passive investments has attracted more investors, just as the amazing performance of tech stocks pulled investors into the dot-com bubble almost 20 years ago.(3)
Passive investing has become incredibly popular and it seems Vanguard and iShares are breaking records almost every month for the amount of cash flowing into their products. For example, investors poured another $34 billion into Vanguard last month bringing the year-to-date (not including June) total to $181 billion – topping their previous (Jan-May) record by more than 40%. I think it is fair to conservatively assume at least 25% of these flows went into US equities (>1/2 into global stocks + US >1/2 of global stocks (4)).
Figure 2: Trend toward passive
Full-service Brokers
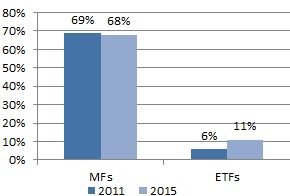 Source: Investment Company Institute, Cerulli Associates |
Fee-based Advisors
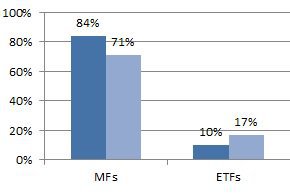 Source: Investment Company Institute, Cerulli Associates |
Using exchange-traded funds (ETFs) and mutual funds (MFs) as proxies for a passive and active investing, respectively, Figure 2 above indicates the increased usage of passive products – especially by fee-based advisors.
Short-volatility Strategies
Short-volatility strategies have also become popular with individual investors. Presumably, this popularity stems from a combination of the following factors:
- The downward trend for volatility in recent years (see Figure 3 below)
- Research indicating short-volatility strategies tend to be profitable over the long-term
- The quest for profit by exchanges and investment banks who deal in volatility products
The key element here is that dealers who issue these products end up on the other side of investors’ short-volatility trades and thus accumulate long volatility exposures. Interestingly, the hedging required for long volatility positions involves selling after markets go up and buying when markets fall. In other words, this hedging can actually dampen market volatility. I describe this fairly technical phenomenon in the appendix where I also provide a broader overview of volatility trading.
Figure 3: Three-month Realized S&P 500 Volatility
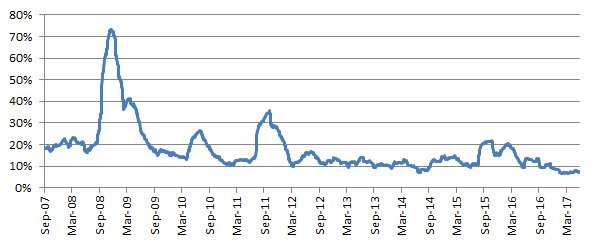
Source: Aaron Brask Capital
It is also worth noting that short-volatility exposures are directionally similar to long market positions. In other words, volatility tends to go down (up) when markets go up (down). Thus short volatility positions typically make and lose money at the same time as long market positions. Accordingly, one could view these short-volatility positions as leveraged positions on the market going up. However, given the complexity and leverage, I suspect short-volatility positions would be among the first evacuated if markets faltered.
It is difficult to ascertain the true magnitude of short-volatility positions. Even though the Commodity Futures Trading Commission (CFTC) breaks out positions between commercial and non-commercial interests, many retail positions are established via exchange-traded notes (ETNs) like XIV and SVXY. Thus, these positions may be established by institutional entities (the ETN issuers), but ultimately held by retail investors.
Notwithstanding, the CFTC reports approximately 125,000 non-commercial short VIX futures positions. These futures use a multiplier of 1,000 (i.e., for each $1 change in the underlying index, the futures contract will change by $1,000) and VIX levels are currently hovering around $10. So this translates into approximately $1.25 billion in short VIX positions. I suspect the true magnitude of retail investors’ short volatility positions is closer to $3 billion since there are slightly more assets in the short-volatility ETNs (I estimate about $1.56 billion).
Using options prices at different strikes, I estimate the VIX would rise by about 5 volatility points if the S&P 500 were to decline by 10%. So the VIX might increase 50% (from 10% to 15%) in the event of a 10% market selloff. In other words, short-volatility positions could lose 50% in this scenario. Based on this back-of-the-envelope calculation, I estimate the embedded leverage in these short-volatility positions is at least 5-to-1.
The above calculation is conservative. Indeed, taking into account the non-linear nature of the VIX calculations (it is actually a variance or volatility-squared index), the embedded leverage is probably closer to 10-to-1. So my $3bn estimate for short-volatility positions might be similar to a $30bn market exposure. As interest grows or contracts in this short-volatility side-bet (it is just a derivative), it will ultimately feed back into the underlying market (S&P 500 stocks). Moreover, I suspect investors in these types of strategies will not likely cling to a buy-and-hold mentality when losses start to mount.
Low-volatility Strategies
Low-volatility strategies represent another fairly recent development in the world of investing. Research indicates that companies with lower volatility (or beta) tended to outperform those with higher volatility. This research offers various reasons to support these findings, but I am skeptical about the reliability or persistence of these strategies (these are 100% price-based technical metrics and ignore the basics of fundamentals and valuation). Notwithstanding, the financial services industry has jumped on the case and created many new products pursuing low-volatility strategies.
This directly relates to the volatility dampening highlighted above. When the volatility of an index is dampened, it naturally imposes similar effects on the volatility of its constituents. Given the VIX is based on the S&P 500 index, this volatility-dampening activity likely makes S&P 500 stocks more attractive to low-volatility funds. Accordingly, this would translate into more cash flows into these stocks supporting their prices and buoying the index itself.
While there was less than $10bn in global low-volatility AUM in 2010 (source: Robeco), there are now over $20bn invested in US low-volatility ETFs and $40bn in ETFs spanning the globe (source: ETFdb.com). While these figures may appear small relative to the flows into passive funds highlighted above, these flows are more targeted and can thus have more impact on the stocks that end up in these funds.
Take, for example, the now famous FAAMG tech stocks. They make up 6 of the top 10 stocks in the S&P 500. As recently highlighted by the Wall Street Journal, technology sector weighting in the Invesco Powershares low-volatility ETF (ticker SPLV) has topped 11% this month – its highest ever weighting in this fund. Up until this year, tech stocks only comprised between 2-6% of this fund. This is an interesting development given that tech stocks have historically been known for having higher volatility.
In recent weeks, volatility has returned to the technology sector. In a twist of irony, the realized volatility of some low-volatility funds (e.g., SPLV and USMV) has been significantly higher than the volatility of the S&P 500 index. In my view, this is a testament to the ill-conceived nature of low-volatility products. I believe low-volatility investing is a fad that will soon be exposed for its shortcomings and find itself in the densely populated graveyard of data-mined strategies.
Conclusions
Disclaimer: The trends I have discussed here are speculative. It is impossible to determine the precise reasons behind the various strategies and transactions highlighted in this article.
On the one hand, we have record levels of money investing in passive, short- and low-volatility strategies.
On the other hand, we are seeing new highs for the market and new lows for volatility with tech stocks driving both trends. I do not believe this is all a coincidence.
My goal with this article was to highlight the potential for this trio of strategies (passive, short-volatility, and low-volatility) to self-perpetuate. To be clear, I believe the current obsession with passive investing is largely responsible for bringing markets to these levels. It has served as the enabler for other investment strategies that have little to no connection with the underlying stocks’ fundamentals. Perhaps short- and low-volatility (and probably many others) strategies merely serve to reinforce this trend.
I am generally an advocate of passive and index-based investment strategies, but this is not to say they are without risks. I see the tremendous popularity of these products both in my professional practice and personal life. Admittedly, there is perhaps no greater marketing pitch than the low fees they advertise. However, it is important to take a step back to understand the potential risks associated with these strategies. At their core, many of them simply do not have a concrete link to the basic essentials of fundamentals and valuations.
I am less enthused with short- and low-volatility strategies. Short-volatility strategies effectively make a leveraged, non-linear bets that markets will go up or sideways. In other words, financially engineers have essentially found yet another way to repackage long market exposures. The relative newness and complexity of these two strategies likely translates into an investor base that doesn’t really understand what they are buying. I suspect these investors will be quick to abandon these strategies if they begin to falter. [wpanchor id=”appendix”]
Appendix: Volatility Feedback Loop
This appendix provides a brief overview of volatility trading and the evolution of volatility-related products. I have tried to keep this discussion in layman’s terms and intentionally been vague in many cases. I do not explain some of the basic terms and definitions (easy to use Google), but I do provide some links to more technical material.
Basics of Options and Volatility
Let us first consider a basic at-the-money straddle (long call + long put option). If you own a straddle on a stock, then you generally do not care if the stock goes up versus down; you just want it to go far in some direction. If the stock rockets in one direction or the other, one option will end up making a big payout while the other one will end up expiring worthless.
Another way to characterize this situation is to say you are long volatility – you are more concerned with the size rather than direction of market moves. If you dig into the mathematics, then you will find the value of ATM options are approximately linear in terms of the volatility parameter (typically referred to as implied volatility). So a straddle represents one relatively simple way to speculate on volatility.
Now if the underlying stock price significantly increases, your call option will be far in-the-money (ITM) and the put option will be approximately worthless. The far ITM call option will behave very similar to holding a share of the stock. In options parlance, its delta will be close to one. The earlier symmetry is lost and you now have a directional exposure (you probably want the stock to go up more). In other words, you lost most of your exposure to volatility. A similar thing would happen on the downside if the stock fell; your call would be far out-of-the-money (OTM) and your put would be far ITM.
One way to mitigate this situation is to delta-hedge. That is, as your exposure to the stock increases (decreases), you could offset the exposure with a short (long) position in the stock itself so that you are once again neutral in terms of directional exposure. This is the critical notion that I believe is impacting market right now.
If you own a long straddle on the market and markets go up, then the (short) delta on the put will fall and the (long) delta on the call will increase. This makes you long delta. So to delta-hedge you will be selling the market. Conversely, if markets go down then you will have to buy the market to delta-hedge. In other words, delta-hedging your long volatility position would translate into taking positions opposite of the way the market moved. If your volatility exposure is large enough, it is possible your delta-hedging activity could actually dampen the volatility of the market. This is what I believe is taking place right now.
Some More Volatility Trading Details
The delta-hedging I highlighted above works to a point. It may keep your directional exposure (temporarily) neutralized, but you lose exposure to volatility because your options behave less like options. That is, when they are very far ITM (or OTM), options lose their payoff symmetry and behave more linearly.
One solution to this problem is to sell the old options and purchase new ones with strikes closer to market levels so they are once again ATM (or close). However, there are potential costs associated with selling your old straddle and purchasing a new one since the expectations for volatility levels – and hence option prices – may change.
Perhaps it would have been better to just buy a bunch of straddles across a spectrum of strikes to lock-in the market price for volatility and these options at inception. Indeed, this is what many traders would do to establish more robust exposures to volatility.
Investment banks attempted to package and offer volatility exposures to clients via volatility swaps. Clients could simply purchase (or sell) a volatility swap from (to) a bank and speculate on volatility. The banks would turn around and hedge these exposures using options and delta-hedging as described above. As intuitive as volatility was, there was a problem. The profit and loss profiles of their hedging did not perfectly replicate the linear exposures to volatility they offered to clients. In other words, their hedging models left them with significant residual risk even after they had their hedges in place.
In the late 1990s, quantitative analysts (notably Emanuel Derman of Goldman Sachs at the time) developed a methodology that would enable a much more precise hedge. However, this model was for hedging variance swaps instead of volatility swaps. That is, these models hedged payoffs that were linear in volatility squared. These new models provided a huge tailwind to the volatility trading industry (even if they were really trading variance) and variance swap trading exploded amongst hedge funds and investment banks.
Evolution of Volatility Products
Not one to be left out of an incredibly profitable trading party, the exchanges were eager to get into the volatility (variance) trading game. Interestingly, the Chicago Board Options Exchange (CBOE) had launched a volatility index – the VIX – in 1993 and it had become the top index for volatility in the US. However, while it was used a barometer of market volatility (many call it the fear gauge), the index was not amenable to trading or hedging. In other words, it was not reasonably feasible to maintain a basket of options that could replicate the payoff defined by the VIX calculation.
The original VIX was based on the level of volatility implied by S&P 100 ATM index options. However, they changed the underlying index to the S&P 500 in 2003. This was presumably done to reflect the greater interest in the S&P 500 versus S&P 100. Moreover, they changed the underlying calculation of the index. In particular, they started using the volatility levels implied from a basket of options across different strikes to make the index more amenable to hedging and trading. In fact, CBOE worked with Goldman Sachs to build a model in line with what was being used by the investment banks (i.e., the variance swap model).
Fast forward until now and the volatility trading market has exploded. There are all sorts of volatility-related products listed and traded on the exchanges. Moreover, new exchange-traded notes (ETNs) have been created that trade on exchanges just like stocks. In other words, all of the complexity and hedging has been packaged up and made accessible to regular investors.
Note: In my view, it is a terrible idea to list volatility products on exchanges where individual investors can trade them. In fact, I recall looking into the listing requirements at the time and finding that the CFTC required new products to be both tangible and add transparency to the markets. Volatility-based products do neither. I can no longer find these requirements in their literature but these products have been a tremendous success for the exchanges and banks – but perhaps not investors. I explained many of the complexities and risks of VIX-based products in a 2011 article. Without delving into the details of that article, it may be informative to consider just how far removed the activity of volatility-trading is from the actual economy.
The table below highlights various layers of investment vehicles wrapped around the core economy that enable volatility-based products. Given the number of layers and associated risks, it would not be surprising if many investors get burned trading volatility-based products (especially the short-volatility products).
Figure 4: House of Cards?
| Layer | Potential risk |
| Business fundamentals | At the core of the market are the fundamentals of the businesses that are collectively owned via the stock market. |
| Market prices | A broad spectrum of market participants buy and sell for different reasons and use the market as a clearing mechanism for price discovery. |
| Index or portfolio dynamics | Index exposures gained via various investment products (e.g., futures and ETFs) suffer from index manipulation issues and the passive investment mechanism may exacerbate mispricing. |
| Options | When options expire, it is possible that interested parties manipulate the prices of the underlying stocks (or other assets) in order to increase the payouts of their options positions. |
| VIX and variance models | Option prices are perhaps even more vulnerable to manipulation than stock prices due to the complexity and lack of liquidity in long-dated or far OTM/ITM options (as are used in the variance models and VIX calculations. |
| Conflict of interest | VXX and other iPath volatility-related ETNs are debt securities issued by Barclays Bank who also makes markets in the underlying products (stocks, index futures, options, other listed volatility products). |
Source: Aaron Brask Capital
References[+]
| ↑1 | FAAMG is an abbreviation referring to the stocks of Facebook, Apple, Amazon, Microsoft, and Google. |
|---|---|
| ↑2 | Disclaimer: The trends I discuss here are speculative. It is impossible to determine the precise reasons behind the various strategies and transactions highlighted in this article. |
| ↑3 | To be fair, the move towards low-cost passive-indexing likely has a secular element to it, but I still believe many investors are performance chasers at heart and will shift back to more active strategies the minute passive market-cap weighted indexes go through an underperformance. |
| ↑4 | MSCI World stock index is approximately 59% invested in US stocks |
About the Author: Aaron Brask
—
Important Disclosures
For informational and educational purposes only and should not be construed as specific investment, accounting, legal, or tax advice. Certain information is deemed to be reliable, but its accuracy and completeness cannot be guaranteed. Third party information may become outdated or otherwise superseded without notice. Neither the Securities and Exchange Commission (SEC) nor any other federal or state agency has approved, determined the accuracy, or confirmed the adequacy of this article.
The views and opinions expressed herein are those of the author and do not necessarily reflect the views of Alpha Architect, its affiliates or its employees. Our full disclosures are available here. Definitions of common statistics used in our analysis are available here (towards the bottom).
Join thousands of other readers and subscribe to our blog.