Genetic programming optimization for a sentiment feedback strength based trading strategy
- Steve Y.Yang, Sheung Yin Kevin Mo, AnqiLiu, Andrei A.Kirilenko
- A version of this paper can be found here
- Want to read our summaries of academic finance papers? Check out our Academic Research Insight category.
What are the research questions?
Based on the evidence that tweets are faster than news in revealing new market information, but that news is regarded a more reliable source of information, the authors propose a superior trading strategy based on the sentiment feedback strength between the news and the tweets.
By studying a total of 1,271,308 tweet messages from a selective group of users among the Twitter Financial Community ( those with the highest betweenness centrality determined to provide the most significant signal on explaining market returns) and 678,378 news articles coming from 2420 distinct providers ( via the Northern Light SinglePoint portal) on the US stock market from 2012 to 2015, they investigate whether:
- Is it possible to exploit the interaction effects between two information sources, tweets and news and build a sentiment-based indicator that utilizes the concept of ‘feedback strength’ to formulate profitable trading strategies ( the benchmark is a buy and hold SP500 ETF)?
- Can genetic programming optimization help formulate a dynamic and adaptive (to recent market conditions) trading system?
What are the Academic Insights?
With the caveat, common to many studies exploiting unstructured data, of the short time frame studied and lack of multiple out of sample tests, they find the following:
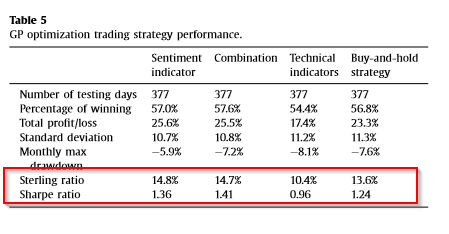
- YES- the authors find that the optimal sentiment feedback strength-based strategy combines business news articles published one day ago and tweet messages generated by the Twitter financial community two days ago. Their combination produces the best performance in terms of the Sterling ratio and the percentage of winning trades.
- YES-The authors conduct 1000 experiments with three groups of indicators (sentiment indicator only, combination of sentiment and technical indicators, technical indicator only) and find that the sentiment indicator only strategy is superior to both the technical indicator and the combination approach during the full period ( 2012-2015) and the out of sample period (2013-2015)
The authors include transaction costs in the analysis as well as they control for overfitting concerns.
Why does it matter?
The authors introduce a framework that exploits the ‘joint’ momentum of news and tweets sentiment. The results suggest that news and tweets sentiment can be regarded as valuable sources of information in constructing trading systems.
Future research can apply this framework on longer horizons as well as international markets to test robustness. AA has some old posts on tweets and finance here, here, and here.
The Most Important Chart from the Paper:
The results are hypothetical results and are NOT an indicator of future results and do NOT represent returns that any investor actually attained. Indexes are unmanaged, do not reflect management or trading fees, and one cannot invest directly in an index.
Abstract
This study is motivated by the empirical findings that news and social media Twitter messages (tweets) exhibit persistent predictive power on financial market movement. Based on the evidence that tweets are faster than news in revealing new market information, whereas news is regarded broadly a more reliable source of information than tweets, we propose a superior trading strategy based on the sentiment feedback strength between the news and tweets using generic programming optimization method. The key intuition behind this feedback strength based approach is that the joint momentum of the two sentiment series leads to significant market signals, which can be exploited to generate superior trading profits. With the trade-off between information speed and its reliability, this study aims to develop an optimal trading strategy using investors’ sentiment feedback strength with the objective to maximize risk adjusted return measured by the Sterling ratio. We find that the sentiment feedback based strategies yield superior market returns with low maximum drawdown over the period from 2012 to 2015. In comparison, the strategies based on the sentiment feedback indicator generate over 14.7% Sterling ratio compared with 10.4% and 13.6% from the technical indicator-based strategies and the basic buy-and-hold strategy respectively. After considering transaction costs, the sentiment indicator based strategy outperforms the technical indicator based strategy consistently. Backtesting shows that the advantage is statistically significant. The result suggests that the sentiment feedback indicator provides support in controlling loss with lower maximum drawdown.
About the Author: Wesley Gray, PhD
—
Important Disclosures
For informational and educational purposes only and should not be construed as specific investment, accounting, legal, or tax advice. Certain information is deemed to be reliable, but its accuracy and completeness cannot be guaranteed. Third party information may become outdated or otherwise superseded without notice. Neither the Securities and Exchange Commission (SEC) nor any other federal or state agency has approved, determined the accuracy, or confirmed the adequacy of this article.
The views and opinions expressed herein are those of the author and do not necessarily reflect the views of Alpha Architect, its affiliates or its employees. Our full disclosures are available here. Definitions of common statistics used in our analysis are available here (towards the bottom).
Join thousands of other readers and subscribe to our blog.