Momentum, Mean-Reversion, and Social Media: Evidence from StockTwits and Twitter
- Shreyash Agrawal, Pablo D. Azar, Andrew W. Lo and Taranjit Singh
- Journal of Portfolio Management
- A version of this paper can be found here
- Want to read our summaries of academic finance papers? Check out our Academic Research Insight category
What are the research questions?
- Do users of social media provide valuable information about liquidity that can be used to predict future liquidity?
- Does social media provide useful information, over and above that provided by traditional, fundamental news sources?
- Do positive and negative sentiment have the same effects on markets?
- Does information gleaned from social-media improve trading strategies?
What are the Academic Insights?
- YES. The authors report that message volume on social media can be used to identify peaks and troughs in stock prices. With very large changes in social media sentiment measures, spreads decreased. Extreme sentiment events were systematically followed by an increase in market liquidity as indicated by lower spreads and mean reversion in prices, over a 30-minute interval. Although, the change in liquidity was not significant. The authors hypothesize that this regularity may be due to increases in attention and trading by retail and institutional investors reacting to the extreme change in social media sentiment.
- YES. There is a significant correlation between measures of social media sentiment and liquidity measures, that is mean reversion in prices and changes in spreads, unexplained by other sources of news sentiment. In general, high volumes of social media sentiment (greater than +/-3SDs from the average for the stock) tend to follow high stock price momentum. A high volume of social media sentiment itself is followed by returns that are mean reverting.
- NO. There is an asymmetry between positive and negative measures of social media sentiment with negative exhibiting a larger impact. A change of about 1% in negative or bearish sentiment has twice the impact of change in positive or bullish sentiment of the same magnitude.
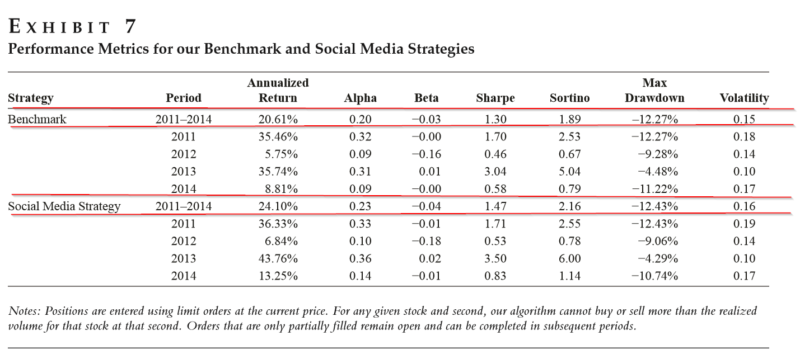
- YES. The observation that high volumes of social media messages are followed by increases in liquidity and a return to mean reversion formed the basis of an intraday trading strategy. Simply put: every half-hour, long positions are taken for equities with negative returns and short positions taken on equity with positive returns. Each position was weighted by the magnitude of the volume of messages on StockTwits and Twitter. For the period 2011-2014, this simple social media trading strategy returned 24.10% and outperformed a benchmark strategy employing mean reversion without social media sentiment that returned 20.64%.
A major caveat is found in comments from the authors:
“Although both of these strategies are profitable, we emphasize that, because of the frequency of trading, these profits are only achievable by market makers with minimal trading costs. Because a large number of our limit orders are being filled, sophisticated traders who follow this strategy could be net liquidity providers, collecting fees that offset a portion of their trading costs.”
In addition, the study did not account for a feedback loop between social media messages and market movements, nor did it account for differences in the influence that users of and messengers via social media may possess.
Why does it matter?
This study demonstrates, albeit over a short period of time, that extreme levels of social media sentiment can have a significant impact on spreads and is related to mean reversion during intraday trading intervals of as much as 30 minutes. Using a strategy that overweights stocks with extremes in volumes of social media messages, and further betting that those stocks will mean revert, can outperform a traditional mean reversion strategy on an intraday level. Caveats aside, these results are pretty interesting.
The most important chart from the paper
The results are hypothetical results and are NOT an indicator of future results and do NOT represent returns that any investor actually attained. Indexes are unmanaged and do not reflect management or trading fees, and one cannot invest directly in an index.
Abstract
We analyze the relation between stock market liquidity and real-time measures of sentiment obtained from the social-media platforms StockTwits and Twitter. Linear regression analysis shows that extreme sentiment corresponds to higher demand and lower supply of liquidity, with negative sentiment having a much larger effect on demand and supply than positive sentiment. An intraday event study shows that booms and panics end when bullish and bearish sentiment reach extreme levels, respectively. After extreme sentiment, prices become more mean-reverting and spreads narrow. To quantify the magnitudes of these effects, we conduct a historical simulation of a market-neutral mean-reversion strategy that uses social-media information to determine its portfolio allocations. Our results suggest that the demand and supply of liquidity are influenced by investor sentiment, and that market makers who can keep their transaction costs to a minimum are able to profit by using extreme bullish and bearish emotions in social media as a real-time barometer for the end of momentum and a return to mean reversion.
About the Author: Tommi Johnsen, PhD
—
Important Disclosures
For informational and educational purposes only and should not be construed as specific investment, accounting, legal, or tax advice. Certain information is deemed to be reliable, but its accuracy and completeness cannot be guaranteed. Third party information may become outdated or otherwise superseded without notice. Neither the Securities and Exchange Commission (SEC) nor any other federal or state agency has approved, determined the accuracy, or confirmed the adequacy of this article.
The views and opinions expressed herein are those of the author and do not necessarily reflect the views of Alpha Architect, its affiliates or its employees. Our full disclosures are available here. Definitions of common statistics used in our analysis are available here (towards the bottom).
Join thousands of other readers and subscribe to our blog.