What’s in Your Benchmark? A Factor Analysis of Major Market Indexes
- Ananth Madhavan, Aleksander Sobczyk and Andrew Ang
- Journal of Portfolio Management
- A version of this paper can be found here
- Want to read our summaries of academic finance papers? Check out our Academic Research Insight category
What are the research questions?
This article examines the magnitude of exposures to a set of systematic factors present in widely accepted Benchmarks (S&P500, the Russells, and MSCI global indices) and how they change over time. The authors use conventional style factors of value, size, quality, momentum, and minimum volatility, and third-party indexes tradeable via ETFs. MSCI single factor indices that are tracked by ETFs are utilized, both global and domestic. Adjustments are made for expense ratios. The analysis is conducted on portfolios constructed using Ang, Madhavan, and Sobczyk [2017] methodology. The resulting portfolios mimic the five factors and are transparent, investible and implemented on a long-only basis. The historical exposures are estimated on a quarterly basis for the period 2002 to 2017.
- Do the factor exposures of market-cap index portfolios typically used to benchmark investment performance vary by index?
- Have those exposures changed over time?
What are the Academic Insights?
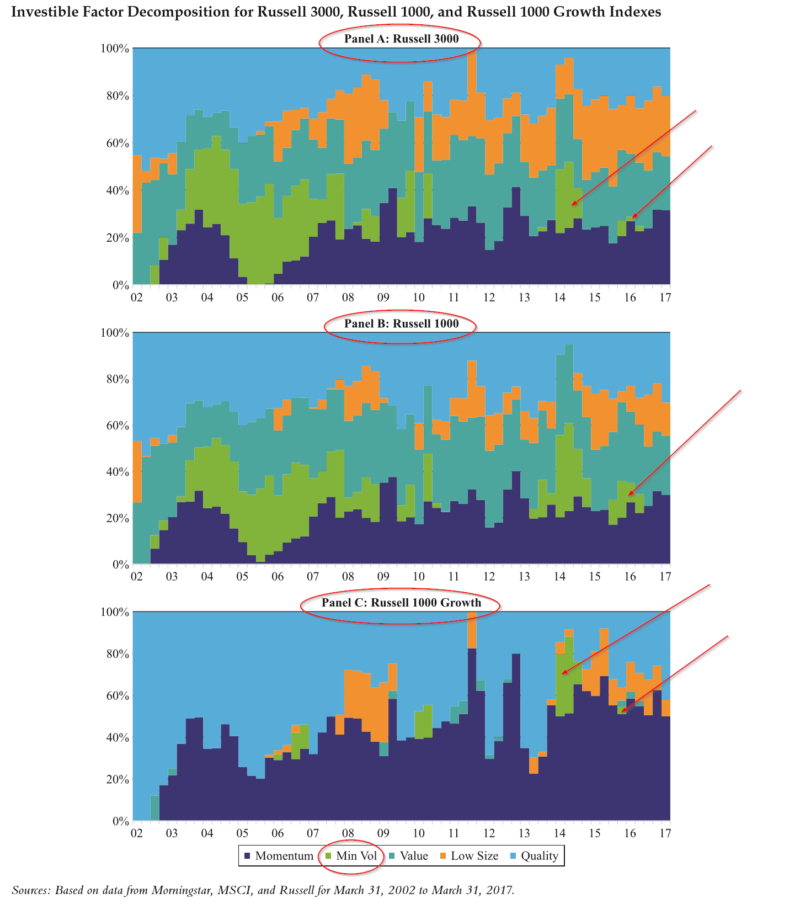
- YES. The current factor exposures, ranked by degree of factor diversification, as of the end of March 2017:
Index Momentum Min Vol Value Low Size Quality Factor Breadth
Russell 3000 31.5% 0.0% 22.8% 25.5% 20.2% 4.19 (most factor diversification)
Russell 1000 29.8% 0.0% 25.5% 14.4% 30.2% 3.76
S&P 500 26.2% 0.0% 27.2% 0.0% 46.6% 2.78
Russell 1000G 50.0% 0.0% 0.0% 7.9% 42.1% 2.31
Russell 1000V 5.8% 33.6% 60.6% 0.0% 0.0% 2.07 (least factor diversification) - YES. Focusing on the S&P500, the minimum factor exposure to quality was 28.0% in December 2008; the maximum exposure to quality was 58.1% in September 2009; the maximum exposure to momentum was 36.8% in December 2012 and the minimum was 0.0% in June 2005; the minimum exposure to volatility is 0.0% was March 2017; it was also zero for 15 quarters between 2009 and 2013; exposures to value remained positive and reasonably consistent across the period. It is notable that the proportion of variability explained by the five factors has increased over the period analyzed. It appears that the five factors are increasingly able to explain and represent the returns of the major indexes. However, the factor breadth was only 2.9, which correspond to a relative factor breadth of approximately 55%. The lesson here is that although investors may assume they are passively invested in the S&P500, they are actually making unintended but material factor bets. On average, there were almost 3 out of 5 possible factor bets being made over the course of the study for the S&P 500. The practical implication is striking in that there is considerably less diversification than one would expect for a 500 stock portfolio. The authors speculate that an investor might have been better off combining a minimum volatility ETF with the S&P 500 ETF, from a risk and return perspective, for example.
Why does it matter?
As the proportion of return variation explained by factors increases within indexes and the ETFs that track them, the need increases for investors to understand the factor exposures present in a portfolio. We are experiencing financial markets that are increasingly driven by macro events and exposures to economy-wide risks. As a result, there is value to be obtained from the analysis of factors and the thoughtful allocation of factors to achieve better diversification and perhaps even improve return performance.
The most important chart from the paper
The results are hypothetical results and are NOT an indicator of future results and do NOT represent returns that any investor actually attained. Indexes are unmanaged and do not reflect management or trading fees, and one cannot invest directly in an index.
Abstract
We examine the factor exposures of several popular market capitalization indexes and how they vary over time. We find that most market capitalization weight indexes are effectively exposed to only two or three factors, with value and momentum being increasingly dominant. We find that the proportion of the index movements explained by factors has materially increased in recent years, which is consistent with a more top-down, macro-driven environment or the increasing importance of economy-wide risks for financial markets.
About the Author: Tommi Johnsen, PhD
—
Important Disclosures
For informational and educational purposes only and should not be construed as specific investment, accounting, legal, or tax advice. Certain information is deemed to be reliable, but its accuracy and completeness cannot be guaranteed. Third party information may become outdated or otherwise superseded without notice. Neither the Securities and Exchange Commission (SEC) nor any other federal or state agency has approved, determined the accuracy, or confirmed the adequacy of this article.
The views and opinions expressed herein are those of the author and do not necessarily reflect the views of Alpha Architect, its affiliates or its employees. Our full disclosures are available here. Definitions of common statistics used in our analysis are available here (towards the bottom).
Join thousands of other readers and subscribe to our blog.