Robert Novy-Marx’s 2013 paper “The Other Side of Value: The Gross Profitability Premium” not only provided investors with new insights into the cross-section of stock returns, but also helped further explain some of Warren Buffett’s superior performance. (Wes Gray summarized that paper here.) His study built upon the 2006 paper “Profitability, Investment and Average Returns” by Eugene Fama and Kenneth French, who showed that firms with high profitability measured by earnings have high subsequent returns after controlling for book-to-market ratio and investment. And as is the case with other factors, profitability had been used for decades by practitioners such as Benjamin Graham and David Dodd. Novy-Marx’s work investigated gross profits, defined as sales minus the cost of goods sold, over the period from 1962 through 2010.
The following is a summary of his findings:
- Profitability, as measured by the ratio of gross profits to assets, has roughly the same power as the book-to-market ratio (a value measure) in predicting the cross-section of average returns.
- Surprisingly, profitable firms generated significantly higher returns than unprofitable firms, despite having significantly higher valuation ratios (for instance, higher price-to-book ratios).
- Profitable firms tend to be growth firms, meaning they expand comparatively quickly. Gross profitability is a powerful predictor of future growth as well as of earnings, free cash flow, and payouts.
- The most profitable firms earn returns 0.31 percent per month higher on average than the least profitable firms. The data are statistically significant, with a t-statistic of 2.49.
- The abnormal return (alpha) of the profitable-minus-unprofitable return spread relative to the Fama-French three-factor model is 0.52 percent per month, with a t-statistic of 4.49.
- The returns data are economically significant, even among the largest, most liquid stocks.
- Gross profitability has far more power in predicting the cross-section of returns than earnings-based measures of profitability.
- High asset turnover (defined as sales divided by assets, an accounting measure of operating efficiency) primarily drives the high average returns of profitable firms, while high gross margins are the distinguishing characteristic of “good growth” stocks.
- Controlling for profitability dramatically raises the performance of value strategies, especially among the largest, most liquid stocks. Controlling for book-to-market ratio improves the performance of profitability strategies.
- While the more profitable growth firms tend to be larger than less profitable growth firms, the more profitable value firms tend to be smaller than less profitable value firms.
- Strategies based on gross profitability generate value-like average excess returns, even though they are actually growth strategies.
- Because both gross profits-to-assets and book-to-market ratios are highly persistent, the turnover of both the profitability and value strategies is relatively low.
- Strategies built on profitability are growth strategies, so they provide an excellent hedge for value strategies. Adding profitability on top of a value strategy reduces the strategy’s overall volatility.
Not only has the profitability factor been persistent, but it’s also been pervasive.
Is Gross Profitability Pervasive?
Novy-Marx tested the profitability strategy in 19 developed international markets over the period from July 1990 through October 2009 and found similar results, demonstrating the pervasiveness of the premium. As further evidence, in the 2015 research report “Dimensions of Equity Returns in Europe,” which covered 15 European markets and the 33-year period from 1982 through 2014, Dimensional Fund Advisors found that the average annual profitability premium in Europe was 3.6 percent. During the same period, the profitability premium in the United States was 4.4 percent.
Thanks to a 2013 research report by Masha Gordon, “The Profitability Premium in EM Markets,” we also have evidence of a profitability premium in emerging markets. In her study, which covered the period from January 1998 through September 2013, she found the annual return on an equal-weighted strategy that went long high return on equity (ROE) and short low ROE was 5.1 percent.
Is Gross Profitability Robust?
The research has also found that the profitability premium has been robust to various definitions (reducing the risk of data mining). While Novy-Marx used gross profitability (gross profits deflated by the book value of total assets), other measures, such as ROE, operating profitability (gross profit less selling, general and administrative expenses excluding research and development expenditures deflated by the book value of total assets) and cash profitability (which accounts for accruals), have worked just as well or even better. In fact, in their 2018 paper, “Choosing Factors,” Fama and French acknowledged that cash-based operating profitability dominates their operating profitability measure.
Because of the evidence on its persistence, pervasiveness and robustness, the profitability factor has been incorporated into asset pricing models, including both the Fama-French five-factor (market beta, size, value, investment and profitability) model and Hou, Xue and Zhang’s four-factor (market beta, size, investment and profitability) Q-model.
Confirming Evidence for Gross Profitability
Matthias Hanauer and Daniel Huber contribute to the literature on profitability as an explanatory factor in the cross-section of equity returns with their August 2018 study, “Constructing a Powerful Profitability Factor: International Evidence.” They investigated the relation between average stock returns and various prominent profitability measures in international markets to determine if international asset pricing models can be improved substantially by adding a profitability factor if it was not already included, or by the choice of the profitability measure underlying the factor. Their study covers the period from July 1989 through June 2016 and 49 countries.
The following is a summary of their findings:
- As illustrated by the following table from the study, there is strong evidence that the profitability effect is globally prevalent, as all profitability definitions besides ROE are robustly priced outside the U.S.
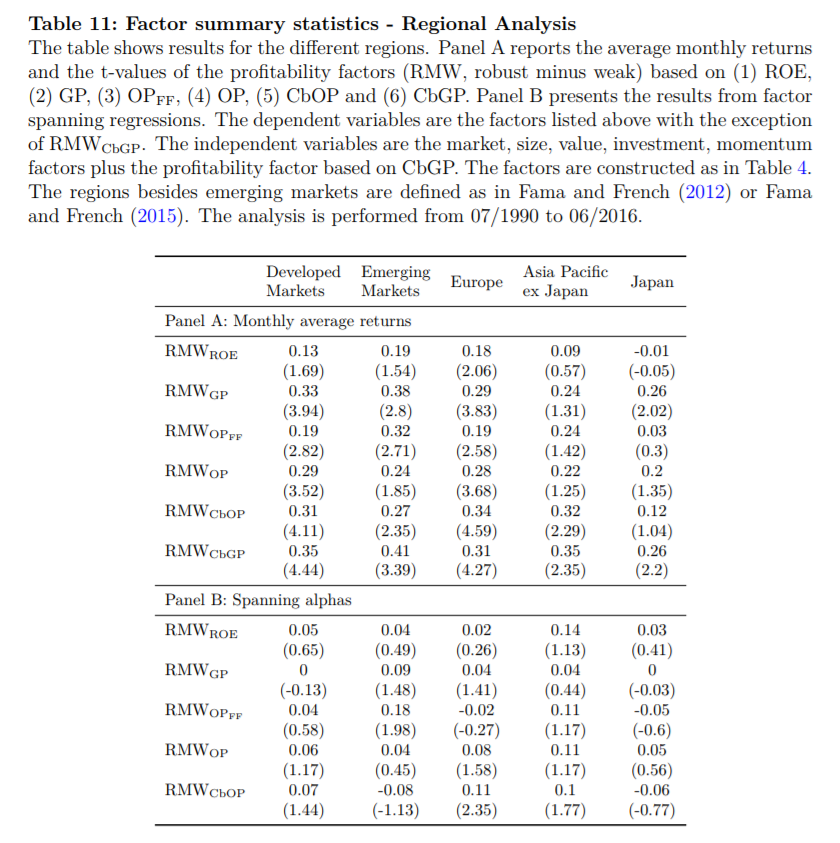
The results are hypothetical results and are NOT an indicator of future results and do NOT represent returns that any investor actually attained. Indexes are unmanaged, do not reflect management or trading fees, and one cannot invest directly in an index.
- Cash-based gross profitability (accounting for accruals, which average 3 percent of total assets) is the dominant profitability factor for developed and emerging markets, respectively, as well as for Japan and the Asia Pacific region ex-Japan (as part of the developed markets). Only in Europe does cash-based operating profitability show slightly better performance than cash-based gross profitability, which is second in rank there. In addition, the cash-based profitability factor exhibits positive average returns and alphas in the majority of developed and emerging markets countries.
- Returns for the cash-based gross profitability factor are quite consistent over time with high returns from 1990 to 2000 and from 2008 to 2016.
Summarizing, the preceding findings led Hanauer and Huber to conclude that “the profitability effect presents a broad and global phenomenon” and that cash-based gross profitability should be substituted for the operating profitability measure used in the Fama-French five-factor model definition because accruals negatively predict future returns.
Before concluding, I’ll take a look at the intuition behind the profitability premium.
Intuitive Explanations for the Gross Profitability Factor
The academic research (such as the 2016 study “The Profitability Premium: Macroeconomic Risks or Expectation Errors?”) provides at least some support for both risk-based and behavioral explanations for the profitability premium. A problem, however, for risk-based explanations is that, intuitively, more profitable firms are less prone to distress and have lower operating leverage than unprofitable firms.
These characteristics suggest that they are less risky. On the other hand, more profitable firms tend to be growth firms, which have more of their cash flow in the distant future. More distant cash flows are more uncertain and should require a risk premium. Another risk-based explanation is that higher profitability should attract more competition, threatening profit margins (and thus making future cash flows less certain). And that, too, creates more risk and should require a risk premium. My own view is that behavioral explanations (mispricings) have greater intuition.
Huijun Wang and Jianfeng Yu, authors of the 2013 study “Dissecting the Profitability Premium,” examined behavioral explanations for the profitability premium. They hypothesized that to the extent the profitability premium reflects mispricing, it should be larger among firms that are more difficult to arbitrage and have greater information uncertainty. In other words, the greater the level of uncertainty, the greater we should expect the impact of investor overconfidence to be on prices. Where there are higher limits to arbitrage, the mispricing is more likely to be sustained. In addition, with greater information uncertainty, psychological biases increase and information is more asymmetric among investors, leaving more room for mispricing. Using a large set of standard proxies recorded in the literature for limits to arbitrage and information uncertainty, the authors found the profitability premium is substantially stronger among firms more difficult to arbitrage or that have greater information uncertainty. Specifically, they found:
- The profitability premium is insignificant or only marginally significant among firms that have low information uncertainty and are easy to arbitrage.
- The profitability premium is about 1 percent higher per month among firms with smaller capitalization, higher return volatility, higher cash flow volatility, less analyst coverage, larger analyst forecast dispersion, fewer institutional holdings, higher idiosyncratic return volatility, lower dollar trading volume, higher bid-offer spread, lower credit ratings, higher illiquidity, and that are younger.
- The majority of the ROE (a measure of profitability) premium is derived from the subsequent low returns of the low-ROE firms. This is consistent with the notion that overpricing is harder than underpricing for arbitrageurs to correct due to greater shorting impediments.
- The profitability premium is not driven by ex-post overreaction (there is no evidence of long-term reversion), but by ex-ante underreaction. Investors underreact to current profitability news, and hence high-profitability (low-profitability) firms are relatively underpriced (overpriced).
Wang and Yu concluded that the profitability premium persists because of limits to arbitrage, which prevent mispricings from being corrected. The fact that pricing errors — instead of rational, risk-based explanations — may be responsible for the majority of the premium does not, however, mean the profitability premium is doomed to disappear (because of those limits to arbitrage).
These findings show that strategies built on profitability are growth strategies, and so can provide an excellent hedge for value strategies. Adding profitability on top of a value strategy reduces overall volatility. Thus, one way to implement the strategy is to incorporate profitability into the construction rules of long-only value funds. This is what research-oriented firms, such as Dimensional Fund Advisors and AQR Capital Management, have done. (Full disclosure: My firm, Buckingham Strategic Wealth, recommends Dimensional and AQR funds in constructing client portfolios.)
For a fuller discussion on the profitability premium, I refer you to my book, “Your Complete Guide to Factor-Based Investing,” which includes a chapter that surveys the literature.
About the Author: Larry Swedroe
—
Important Disclosures
For informational and educational purposes only and should not be construed as specific investment, accounting, legal, or tax advice. Certain information is deemed to be reliable, but its accuracy and completeness cannot be guaranteed. Third party information may become outdated or otherwise superseded without notice. Neither the Securities and Exchange Commission (SEC) nor any other federal or state agency has approved, determined the accuracy, or confirmed the adequacy of this article.
The views and opinions expressed herein are those of the author and do not necessarily reflect the views of Alpha Architect, its affiliates or its employees. Our full disclosures are available here. Definitions of common statistics used in our analysis are available here (towards the bottom).
Join thousands of other readers and subscribe to our blog.