There’s a large body of research, including the 2017 study “Tail Risk Mitigation with Managed Volatility Strategies” by Anna Dreyer and Stefan Hubrich, that demonstrates that, while past returns do not predict future returns, past volatility largely predicts future near-term volatility—volatility is persistent (
Such evidence has led to the development of strategies that manage volatility—target a constant level of volatility rather than a constant nominal exposure—by leveraging a portfolio at times of low volatility and scaling down at times of high volatility.
Campbell R. Harvey, Edward Hoyle, Russell Korgaonkar, Sandy Rattray, Matthew Sargaison, and Otto Van Hemert, contribute to the literature on managing volatility with their study “The Impact of Volatility Targeting,” which appears in the Fall 2018 issue of The Journal of Portfolio Management. They examined the impact of volatility targeting on 60 assets, with daily data beginning as early as 1926. Their data sample ends in 2017. Using the standard deviation of daily returns to estimate volatility, they set a volatility target of 10 percent. Checking for robustness, they also tested intraday volatility measures. Their results include estimates of trading costs.
The following is a summary of their findings:
- In
U.S , equities, scaling reduces volatility—the volatility of volatility is reduced from 4.6 percent for unscaled returns versus 1.8 percent for volatility-scaled returns. - Excess kurtosis (fatter tails than in normal distributions) is reduced as volatility scaling cuts both tails, right (good tail) and left (bad tail).
- Sharpe ratios (measure of risk-adjusted return) are higher with volatility scaling for risk assets (equities and credit), as well as for portfolios that have a substantial allocation to these risk assets, such as a balanced (60 percent equity/40 percent bond) portfolio and a risk parity (equity/bond/credit/commodity) portfolio. Specifically, for U.S. equities the Sharpe ratio improves from 0.40 (unscaled) to between 0.48 and 0.51 (volatility scaled) and is not very sensitive to the choice of volatility estimate.
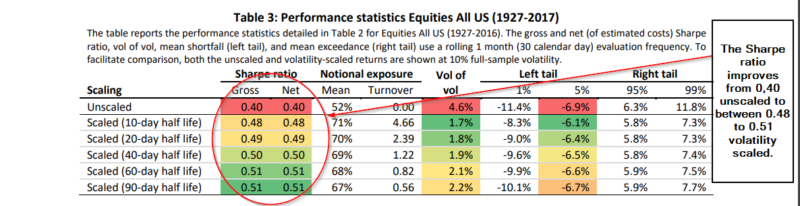
The results are hypothetical results and are NOT an indicator of future results and do NOT represent returns that any investor actually attained. Indexes are unmanaged and do not reflect management or trading fees, and one cannot invest directly in an index.
- Risk assets exhibit a negative relationship between returns and volatility. Thus, volatility scaling effectively introduces some momentum into strategies—since volatility often increases in periods of negative returns, targeting volatility causes positions to be reduced, which is in the same direction as what one would expect from a time-series momentum (trend following) strategy.
- Volatility targeting consistently reduces the likelihood of extreme returns (and the volatility of volatility) across our 60 assets—a favorable trait for
risk averse investors—reducing maximum drawdowns for both the balanced and risk parity portfolios.
Harvey, Hoyle, Korgaonkar, Rattray, Sargaison, and Van Hemert concluded that their analysis suggests that for risk assets the targeting volatility effectively introduces some
Harvey, Hoyle, Korgaonkar, Rattray, Sargaison, and Van Hemert also observed that while volatility targeting did not improve the Sharpe ratio of non-risk assets (such as commodities), it did reduce the likelihood of extreme returns (and the volatility of volatility) across all assets. They noted: “The lower probability of very negative returns (left-tail events) is valuable for investors.”
Further Evidence
Before summarizing, we need to also examine the aforementioned 2017 study by Anna Dreyer and Stefan Hubrich, “Tail Risk Mitigation with Managed Volatility Strategies,” as their findings have important implications for understanding the nature of managed volatility strategies. Their study covered the period from 1926 through 2016. The authors found managed volatility (MV) strategies that dynamically alter their daily equity market exposure according to the ratio of realized past long-term equity volatility to trailing 20-day realized volatility (the former represents the volatility target; the latter represents the forecast) have “consistently hugged the target volatility within a much tighter range than the benchmark itself.”
Dreyer and Stefan Hubrich write:
This observation holds even during turbulent market episodes like the mid-1970s, the 1987 crash, the tech bubble/crash in the early 2000s, and the Global Financial Crisis (GFC) in 2008-09.
More specifically, they found 90 percent of their realized volatility observations for MV fell into the 0.68 percent to 1.59 percent interval while the range for the benchmark was much wider at 0.41 percent to 2.04 percent.
Reduced volatility and less downside risk are clearly important both to risk-averse investors and to all investors who are in the withdrawal stage, when the sequence of returns can matter greatly. Reduced downside risk can also help investors prone to panic selling, which generally increases in severe bear markets.
While MV strategies are related to time-series momentum, they don’t perform similarly in all environments. However, realized volatility and returns do tend to be negatively correlated. For example, Dreyer and Hubrich found that the correlation for 60-day windows in their sample is -0.25—volatile periods tend to be associated with “bad news” and market selloffs. In other words, volatility tends to spike up, not down.
Note that if market returns are positive, the use of leverage allows MV strategies to capture enhanced returns when volatility is low. By reducing leverage when volatility is high (and when returns tend to be poor), MV strategies tend to avoid the worst of bear markets. And the research shows that Sharpe ratios (SRs) are lower (higher) when volatility is higher (lower). This enabled Dreyer and Hubrich to conclude that MV strategies are not only related to time-series momentum, but also to returns’ long-term mean reversion.
Dreyer and Hubrich did note that while SRs were improved in all three of the periods they examined (the full period from 1960 through 2016 and two sub-periods, 1960 through 1989 and 1990 through 2016), they found what they called the “hit rate” (persistence of a higher SR over 10-year rolling periods) was not high.
Specifically, the authors found that, starting in 1929, “which has the greatest overall SR improvement, these hit rates are barely above 50%. The hit rate is higher in the later periods, but never much above 60%.” They attributed “any MV SR improvement to perhaps 1-2 crisis periods in the particular sample. Since these crisis periods do not occur often, investors can often see a decade without a SR improvement from MV.”
In other words, as with value investing, or any other investment strategy, MV strategies often require great patience and discipline to recap their benefits. The authors warn: “In practice, investors pursuing pure MV strategies for SR enhancement should consider the potential for regret risk even with a long-term commitment to the strategy.”
Dreyer and Hubrich then turned their attention to the higher moments of the distribution of returns: skewness and kurtosis.
They found that:
- MV strategies had lower values for kurtosis and more positive skewness for nearly all expanding-window periods since 1929.
- MV strategies consistently thin the tails at 20-day and 60-day holding periods. At these holding periods, the benchmark features meaningful excess kurtosis while MV essentially produces normal tails with kurtosis close to three.
These results led Dreyer and Hubrich to conclude that “MV strategies have historically provided more return per unit of tail risk than the benchmark.” They noted this outcome is likely due to the tendency for volatility to cluster—realized volatility can remain conditionally higher or lower than the average for extended periods.
Dreyer and Hubrich next turned to examining drawdowns. They write: “MV improves the relevant ratios by 35-50% over the full sample, 15-20% over the sample starting in 1990, and essentially scores on par with the benchmark for the sample starting in 1960.” Lower drawdowns also led to higher compound returns (recall that Sharpe ratios are based on annual average returns). Given the high level of most investors’ risk aversion, these improvements can offer investors significant benefits in terms of utility.
Summary
When viewed through the lens of the Sharpe ratio, the research demonstrates that while MV has enhanced outcomes, on average, over the buy-and-hold benchmark, it does so with great variation. In addition, enhancements are period-dependent. However, they do alter the higher moments of the return distribution in a favorable way, enhancing skewness and removing fat tails. Thus, they improve utility for risk-averse investors.
It’s also important to note that MV strategies are characterized by material turnover and trading activity due to their dynamic adjustment of exposures. The result is that MV strategies are likely to be tax inefficient. Thus, investors should strongly prefer to hold them in tax-advantaged accounts—unless the strategies are specifically managed for tax awareness, as is the case with AQR’s Alternative Risk Premia Fund (QRPRX).
Finally, funds such as AQR’s Style Premia Alternative Fund (QSPRX), AQR’s Managed Futures Strategy Fund (AQMRX) and the Stone Ridge All Asset Variance Risk Premium Fund (AVRPX) have been successfully managing portfolios to a targeted volatility for a number of years now—increasing leverage and exposure when volatility is falling and decreasing them when volatility is rising. (Full disclosure: My firm, Buckingham Strategic Wealth, recommends
References[+]
| ↑1 | For a detailed look at |
|---|---|
| ↑2 | For an encompassing review of trend following (momentum) check the article here |
About the Author: Larry Swedroe
—
Important Disclosures
For informational and educational purposes only and should not be construed as specific investment, accounting, legal, or tax advice. Certain information is deemed to be reliable, but its accuracy and completeness cannot be guaranteed. Third party information may become outdated or otherwise superseded without notice. Neither the Securities and Exchange Commission (SEC) nor any other federal or state agency has approved, determined the accuracy, or confirmed the adequacy of this article.
The views and opinions expressed herein are those of the author and do not necessarily reflect the views of Alpha Architect, its affiliates or its employees. Our full disclosures are available here. Definitions of common statistics used in our analysis are available here (towards the bottom).
Join thousands of other readers and subscribe to our blog.