I’d argue that a typical investor believes the following–In the past and over the long run, stocks outperformed bonds.(1)
However, as highlighted here, an academic paper last year shows that the majority of individual U.S. stocks actually lost compared to Treasury Bills (i.e. the return to cash)!
For many investors, that is a stunning finding. (note: the stats for stocks with value and momentum characteristics are very different).
So a natural follow-up question is the following–how did Global stocks do relative to cash?
The paper below, titled “Do Global Stocks Outperform U.S. Treasury Bills?” updates the previous findings by adding Global stocks.
Below is the abstract:
We study compound returns to nearly 62,000 global common stocks during the 1990 to 2018 period, documenting that the majority, 56% of US stocks and 61% of non-US stocks, underperform one-month US Treasury bills over the full sample. Focusing on aggregate shareholder wealth creation measured in US dollars, we find that the top-performing 1.3% of firms account for the $US 44.7 trillion in global stock market wealth creation from 1990 to 2018. Outside the US, less than one percent of firms account for the $US 16.0 trillion in net wealth creation. These results highlight the practical implications of the fact that the distribution of long-run stock returns is strongly positively skewed. *Do Global Stocks Outperform US Treasury Bills?
So the paper finds that, on average, global stocks lost relative to U.S. Treasury Bills (cash)!
What are the stats?
Well, of the $44.7 trillion ($USD) worth of net wealth creation, this can be accounted for by ~1.33% (811) of the firms!
The above statistic can be viewed in the chart below showing that 811 firms account for the entire net wealth creation.
But besides wealth creation, what percentage of firms outperform U.S. Treasury bills from 1990-2018?
We find that only 40.5% of global common stocks, including 43.7% of US stocks and 39.3% of non-US stocks, have full-sample buy-and-hold return that exceeds the accumulated return to one-month US Treasury Bills over matched time horizons.
While B&H is one way to calculate returns, dollar-weighted returns (IRR) may be better as it would describe the return an investor in an individual stock would receive. So what are the stats using dollar-weighted returns?
We find that the dollar-weighted return exceeds the Treasury-bill return over the matched time horizon for an even lower proportion of stocks, 39.1% globally and 37.5% for non-US stocks.
A neat anecdote on the difference between the B&H return and the dollar-weighted return is found in the paper:
Vodafone Group, Plc provides an example of the opposite outcome, where the IRR to shareholders in aggregate reflects worse performance as compared to the return to a buy-and-hold investor. In February 2000 Vodafone acquired Mannesmann, a German industrial conglomerate, for £112 billion, the largest corporate acquisition in history as of that date.18 The acquisition approximately doubled Vodafone’s market capitalization. Vodafone’s share price subsequently languished, dropping from $US 5.61 in February 2000 to $US 1.95 at the end of our sample in December 2018. The geometric mean return to Vodafone stock during our full January 1990 to December 2018 sample was 9.21% per year, equating to a full sample buy-and-hold return (inclusive of reinvested dividends) of 1,179%. In contrast, the internal rate of return to shareholders in aggregate was just 0.75% per year. The divergence is substantially attributable to the poor performance of Vodafone shares subsequent to the increase in the magnitude of shareholder investment in February 2000. By comparison, the geometric mean return to one-month US Treasury bills during the sample period was 2.72% per year, and by our calculations Vodafone’s stock market performance reduced shareholder wealth by $US 53.1 billion during the 1990 to 2018 period.
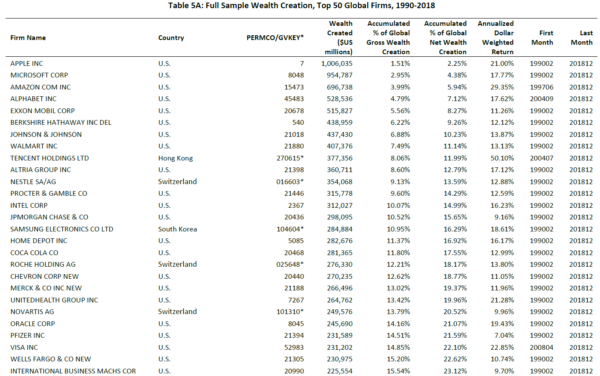
So who are the winning firms?
This is shown in Table 5A of the paper, with a partial image shown below:
Conclusion
So what should we make of the results in the paper?
It is clear that the paper highlights that the unconditional probability of picking the “winning” stocks is low. Only 1.3% of all stocks accounted for 100% of the net wealth creation! Thus, the remaining 98.7% accounted for no net wealth creation. In addition, while ~40% of individual stocks outperformed cash, that means the remaining ~60% lost to cash!
While the odds may not be the same in the future, it highlights that in the past, trying to randomly pick stocks would have been a loser’s game.
So while it is true that diversified market-cap-weighted stock portfolios beat bonds and cash in the past, it is also true that the majority of individual stocks (including global stocks) lost to cash.
In addition to the 811 firms that created wealth equivalent to the full sample, another 23,094 firms (37.8% of the total) generated positive wealth for their shareholders. However, the wealth creation of these 23,094 firms just offset the wealth destruction of the remaining 37,195 (60.9% of firms), such that the 60,289 firms (98.7% of total) outside of the top 811 best performers collectively generated returns on invested capital that just matched one-month Treasury bills.
I’d highly recommend everyone read the paper!
Do Global Stocks Outperform US Treasury Bills?
- Hendrik Bessembinder, Te-Feng Chen, Goeun Choi, and K.C. John Wei
- A version of the paper can be found here.
We study compound returns to nearly 62,000 global common stocks during the 1990 to 2018 period, documenting that the majority, 56% of US stocks and 61% of non-US stocks, underperform one-month US Treasury bills over the full sample. Focusing on aggregate shareholder wealth creation measured in US dollars, we find that the top-performing 1.3% of firms account for the $US 44.7 trillion in global stock market wealth creation from 1990 to 2018. Outside the US, less than one percent of firms account for the $US 16.0 trillion in net wealth creation. These results highlight the practical implications of the fact that the distribution of long-run stock returns is strongly positively skewed.
References[+]
| ↑1 | and definitely beat cash! |
|---|---|
| ↑2 | Figure 4 is a neat image from the paper shows the B&H return distribution over the entire time period
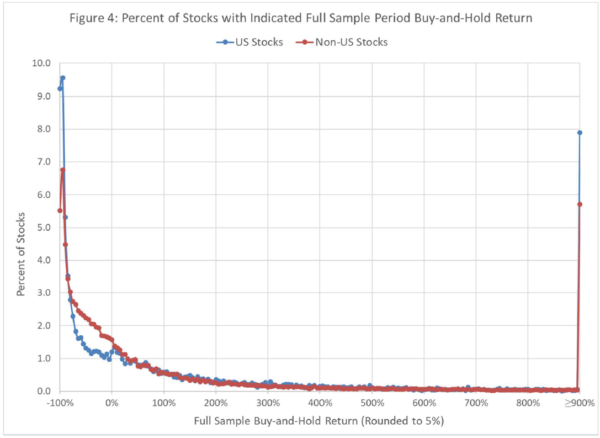 As can be seen above, a large percentage of firms have negative returns, with ~9% and 5.5% of U.S. and non-U.S. firms having -100% B&H returns! |
About the Author: Jack Vogel, PhD
—
Important Disclosures
For informational and educational purposes only and should not be construed as specific investment, accounting, legal, or tax advice. Certain information is deemed to be reliable, but its accuracy and completeness cannot be guaranteed. Third party information may become outdated or otherwise superseded without notice. Neither the Securities and Exchange Commission (SEC) nor any other federal or state agency has approved, determined the accuracy, or confirmed the adequacy of this article.
The views and opinions expressed herein are those of the author and do not necessarily reflect the views of Alpha Architect, its affiliates or its employees. Our full disclosures are available here. Definitions of common statistics used in our analysis are available here (towards the bottom).
Join thousands of other readers and subscribe to our blog.