In my June 4, 2019 article “The Re-Death of Value, or Déjà Vu All Over?” I noted that one possible explanation for at least part of the poor performance of value stocks over the past decade has been the sharp fall in both the real interest rate (due to weak global growth) and unexpected inflation. As supporting evidence, I cited a study which found that those two outcomes favor longer duration stocks over shorter duration stocks—duration being the average maturity (in years) of cash flows—and growth (value) stocks, with more (less) of their cash flows in the future, are long (short) duration stocks.
However, it’s important to note that changes in the required equity risk premium are likely to be the predominant driver of risk premia differentials. The Federal Reserve’s easy monetary policy, driving interest rates to historically low levels (and keeping them there for the past decade) led many investors to take on more risk in search of higher returns. The result was higher equity valuations, and, thus, a lower equity risk premium. While the lower required equity risk premium helped all stocks, relatively speaking it helped longer duration (growth) stocks more than shorter duration (value) stocks. And that may explain more of the outperformance of growth stocks. You see the same phenomenon with high yield bonds—with most of the return variation coming from changes in spreads, not the level of interest rates.
Latest Contribution to the Literature
Andrei Gonçalves contributes to the asset pricing literature with his June 2019 paper, “The Short Duration Premium.” He studied the performance of equity portfolios sorted on cash flow duration, ranking stocks based on whether the firm value is concentrated in short- or long-term cash flows. For equal-weighted portfolios, he excluded microcaps (firms below the 20 percent quantile of market equity based on NYSE breakpoints) to make sure the results were not due to these firms. To calculate the duration of a stock Goncalves calculated a firm’s total payout (dividends + repurchases – issuances) relative to its market equity. A stock with a relatively high total payout (6 percent) would have a low equity duration of 17.7 years, and a stock with a relatively low total payout (1 percent) would have a high equity duration of 101 years. His database covered U.S. stocks over the period from 1973 to 2017.
The following is a summary of his findings:
- There is a strong premium for short duration stocks. He concluded that this is consistent with this premium existing in equilibrium because earning it requires exposure to reinvestment risk, which is undesirable from the perspective of long-term investors.
- Short duration stocks provided a large premium—9.2 percent per year in value-weighted decile portfolios—relative to long-duration stocks despite having lower market betas.
- The premium is long-lived (lasts for at least five years) and is strong even among large firms (market equity in the highest NYSE quintile).
- The short duration decile tends to be composed of small, value, and profitable companies. The opposite is true for the long-duration decile.
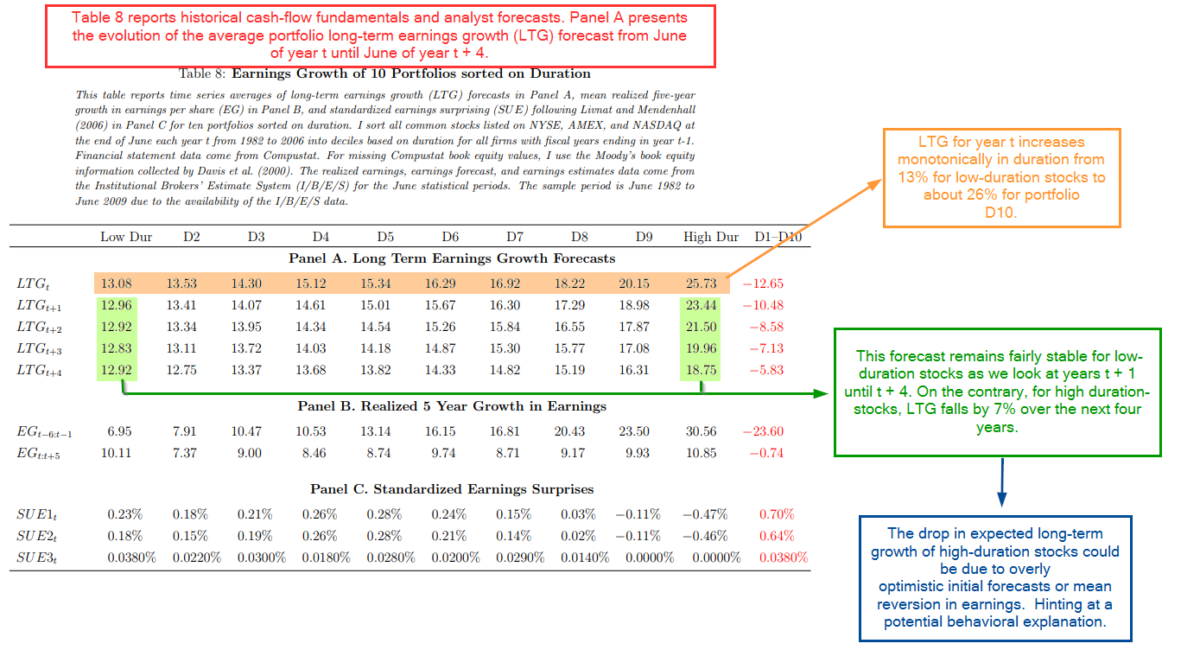
- Firms in the short duration portfolio tend to pay, on average, about 35 percent of their market equity over the first 10 years after duration is measured versus 15 percent for firms in the long duration portfolio—firms classified as short duration equity have a larger fraction of firm value associated with short term cash flows in comparison to long-duration firms.
- The short duration premium (value- and equal-weighted) on a 20-year rolling window is not concentrated in any particular period, being positive for all 20-year windows.
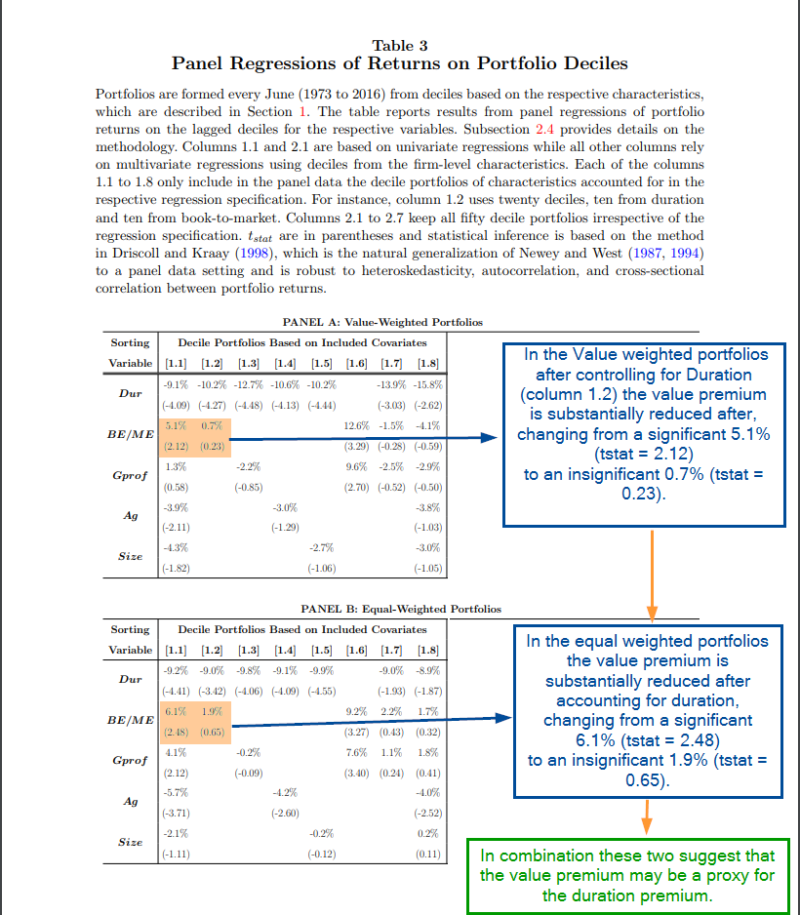
- After controlling for duration, the value premium is dramatically reduced (-0.7 percent) and is statistically insignificant, and the profitability premium becomes negative. This result is stronger if value, profitability, and duration are all included in joint tests with both becoming negative.
Goncalves explained how the short duration premium originates.
Decreases in expected wealth growth are induced by lower expected returns, and thus are associated with increases in equity prices through lower discount rates. Since longer duration stocks are more sensitive to discount rates, their prices increase by more when expected wealth growth declines, inducing negative returns on the short duration strategy. Consequently, the short duration strategy is strongly exposed to reinvestment risk.
He added:
Intuitively, if two firms have different growth opportunities, but the same profitability, the one with less growth opportunities (the value firm) will save/invest less and pay more of its resources over the short term, becoming a short duration company. Similarly, if two firms have different profitability, but similar growth opportunities, the more profitable one will have more resources to distribute to investors in the near future and become a short duration firm.
He concluded that his findings, “suggest that the value and profitability premia are proxies for the short duration premium, which does not resemble an anomaly that concentrates on small stocks and quickly disappears.”
Consequently, understanding the fundamental driver of the short duration premium can help us better understand the cross-section of stock returns.
The results are hypothetical results and are NOT an indicator of future results and do NOT represent returns that any investor actually attained. Indexes are unmanaged, do not reflect management or trading fees, and one cannot invest directly in an index.
Goncalves provides a risk-based explanation for the value premium. And his findings are consistent with those of Niels J. Gormsen and Eben Lazarus, authors of the April 2019 paper “Duration-Driven Returns.” They analyzed a dataset of single-stock dividend futures (claims to stock level dividends that are paid out during a given calendar year) often referred to as dividend strips which can be thought of as the equity equivalent of a zero-coupon bond for an individual firm.
Their study, which covered stocks in 23 developed countries between August 1963 and December 2018 found:
- Both in the U.S. and globally, firms that have exposure to the profitability, investment, low risk, and payout factors have lower future growth rates, high expected returns, and short cash-flow duration—they are expected to earn most of their cash flows in the near future. For example, the short-duration portfolio has a realized annual dividend growth rate of 0 percent in real terms. The growth rates steadily increase to 5 percent in the high-duration portfolio.
While the above findings are consistent with the risk-based explanation for the value premium, the literature does provide an alternative behavioral-based explanation—investors are persistently over-optimistic about the prospects of long duration (growth) companies which leads to poor returns.
Alternative Explanation
In his study, “Cash Flow Duration and the Term Structure of Equity Returns,” Michael Weber noted:
Analysts expect stocks with high cash flow duration to grow twice as fast over the following five years compared to low-duration stocks. This difference in growth forecasts shrinks by more than 50% over the next five years. Analysts seem to extrapolate from past earnings growth into the future. High-duration stocks indeed grew substantially faster in the past than low-duration stocks, but they have the same growth in earnings over the following five years.
The excessive optimism for longer duration growth stocks and the excessive pessimism for shorter duration value stocks is what creates the value premium. And limits to arbitrage, especially in hard and expensive to short smaller stocks, allows the premium to persist. For example, Weber found: “The spread in excess returns is strongest among stocks that are potentially the most short-sale constrained: low-duration stocks outperform high-duration stocks on average by 1.32% per month in the lowest institutional ownership class” (institutions provide the vast majority of supply of securities for loan and their low ownership causes costs of shorting to be high).
Weber also found that while a portfolio long low-duration stocks and short high-duration stocks earn a statistically significant five-factor alpha of 0.48 percent per month, the return of this arbitrage portfolio varies substantially with investor sentiment, being three times higher after periods of high investor sentiment. For those interested, the seminal paper on the subject of behavioral errors by investors is the 1994 study “Contrarian Investment, Extrapolation and Risk” by Joseph Lakonishok, Andrei Shleifer, and Robert Vishny.
Further Problems for the Duration Premium
An anomaly for the duration premium is that momentum stocks have historically delivered a large premium, and they tend to be longer duration, growth stocks. Thus, duration cannot explain the momentum premium. And momentum is a behavioral-based phenomenon, without an intuitive risk-based explanation.
There is a larger challenge for the duration premium. While there are papers published in peer-reviewed journals that present evidence supporting a downward-sloping term structure for the equity risk premium (such as the June 2016 study “The Term Structure of Returns: Facts and Theory,” by Jules van Binsbergen and Ralph Koijen), there is a real debate in the academic community about whether this is correct. The problem is that logically, the longer you extend the duration of cash flows, the greater the uncertainty there must be about those cash flows. And greater uncertainty should produce greater risk premium. It seems hard to come up with a risk-based explanation for a downward sloping equity risk premium. On the other hand, behavioral economists can provide one—investors are myopic and focus more on the short-term.
Summary
The search for the source of the value premium, behavioral- or risk-based, continues with the literature providing us with findings on both sides. The three papers discussed above contribute to the debate, providing some new insights. But the debate will continue as more research explores this interesting theory.
My own view is that the issue, at least as it relates to the value premium, is that it is neither black nor white—it is likely that the value premium has two sources, with some risk-based explanations (such as value companies having more irreversible capital and greater volatility of earnings and dividends), and also with some behavioral ones (such as investors confusing familiarity with safety, anchoring, loss aversion, and investors underestimating the reversion to mean of abnormal earnings for both growth and value companies). And the behavioral explanations help explain why the value premium has historically been much larger in small stocks where limits to arbitrage are stronger. Another possible explanation is that there is a much larger dispersion in risk exposure in small stocks than large stocks. Both explanations are plausible and both could be contributing at the same time.
About the Author: Larry Swedroe
—
Important Disclosures
For informational and educational purposes only and should not be construed as specific investment, accounting, legal, or tax advice. Certain information is deemed to be reliable, but its accuracy and completeness cannot be guaranteed. Third party information may become outdated or otherwise superseded without notice. Neither the Securities and Exchange Commission (SEC) nor any other federal or state agency has approved, determined the accuracy, or confirmed the adequacy of this article.
The views and opinions expressed herein are those of the author and do not necessarily reflect the views of Alpha Architect, its affiliates or its employees. Our full disclosures are available here. Definitions of common statistics used in our analysis are available here (towards the bottom).
Join thousands of other readers and subscribe to our blog.