Crowded Trades: Implications for Sector Rotation and Factor Timing
- William Kinlaw, Mark Kritzman, and David Turkington
- Journal of Portfolio Management
- A version of this paper can be found here
- Want to read our summaries of academic finance papers? Check out our Academic Research Insight category
What are the research questions?
- What is a crowded trade?
- What is asset centrality?
- Does asset centrality predict bubbles? Can it be exploited?
What are the Academic Insights?
- In the normal course of events, investors perceive and act upon changes in fundamentals that will persist indefinitely (or until the next change in fundamentals) resulting in price movements that are difficult to anticipate or otherwise exploit. In contrast to “normal” changes in fundamental values of securities, crowded trades produce price changes by virtue of large capital inflows to securities with common, or at least similar, characteristics of some sort. In this context, similarity can refer to a common sector, common factor exposures, etc. Such capital flows are usually motivated by shifts in market psychology towards a specific grouping of stocks such as Value or the result of investors piling in on the latest and greatest strategy in large numbers. The critical distinction of a crowded trade is the lack of a shift in fundamentals accompanying the large price movement. By its very nature, crowded trades are transitory, possibly predictable, but certainly more amenable to exploitation.
- Asset centrality (AC) is a statistical measure associated with a set of similar securities that reflects their ability to influence the return variability of a larger universe of securities to which the original set belongs. Higher (lower) levels of volatility and connectedness makes for higher (lower) ACs. The AC is higher for relatively more volatile sectors/factors as well as sectors/factors that are associated or more connected to other sectors/factors. The mechanics are translated in two ways:
- via large order imbalances that result from large quantities of dollars used to buy or sell a particular sector/factor and produce large price changes and therefore higher volatility;
- via decreasing diversification within sectors/factors as investors buy or sell the sector or factor as a unit as opposed to buying or selling individual constituents. The AC measure is a modification of principal components output into the absorption ratio (a measure of risk concentration) to determine the degree of influence on return variance present.
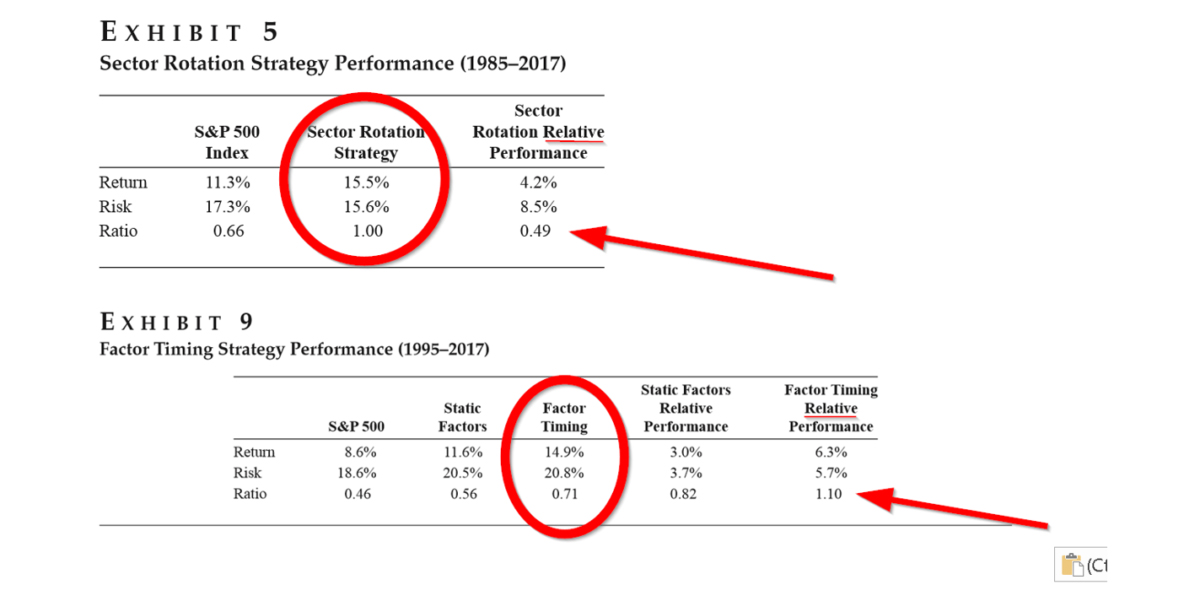
- YES. The authors review several well-publicized bubbles that occurred between 1998 and 2013 and establish the potential of the AC measure to identify asset bubbles, at least on an anecdotal basis. Following that, they test sector timing and factor timing strategies using changes in a standardized value of the group AC on a relational basis. A relative valuation measure is added to distinguish scenarios where a significant change in AC is not accompanied by a change in fundamentals. Following that, they test sector timing and factor timing strategies using changes in a standardized value of the AC on a relational basis. The strategies identify run-up and sell-off phases within a time frame that would add sufficient value to the performance of a passive benchmark. The study documents that using AC and relative value in combination is a powerful signal, however, used separately are not useful for timing. A two-part trading rule was implemented based on the hypothesis that sectors and factors with high ACs (therefore crowded sectors or factors) but no overvaluation are signals of a run-up to a bubble and those with high ACs and overvaluation are signals of a sell-off. Exhibits 5 (for sectors) and 9 (for size, value, quality, and low volatility factors) revealed that this barebones trading rule produced very attractive risk/return results.
Why does it matter?
This article is a definite read for anyone interested in the phenomenon of asset bubbles. Academics are on both sides of the fence when it comes to the possibility of identifying bubbles before they crumble. The authors make a significant contribution via the AC measure and its use in identifying, timing run-ups and sell-offs, and exploiting those same sector and factor bubbles. Kritzman, et al, previously developed the absorption ratio and have now extended it’s usefulness with this article. Risk managers should take note of this work.
Readers are referred to the article for a complete explanation of the AC calculation and the specifics of the timing strategy they utilize.
The most important chart from the paper
Abstract
Crowded trades are often associated with bubbles. If investors can locate a bubble sufficiently early, they can profit from the run-up in prices. But to profit from a bubble, investors must exit the bubble before the sell-off erodes all of the profits. The authors propose two measures for managing exposure to bubbles. One measure, called asset centrality, locates crowded trading, which they show is often associated with the formation of bubbles. The other is a measure of relative value, which helps to separate crowding that occurs during a bubble’s run-up from crowding that occurs during a bubble’s sell-off. Neither measure by itself is sufficient for identifying the full cycle of a bubble, but the authors show that together these measures have the potential to locate bubbles in sectors and in factors as they begin to emerge and to identify exit points before they fully deflate.
About the Author: Tommi Johnsen, PhD
—
Important Disclosures
For informational and educational purposes only and should not be construed as specific investment, accounting, legal, or tax advice. Certain information is deemed to be reliable, but its accuracy and completeness cannot be guaranteed. Third party information may become outdated or otherwise superseded without notice. Neither the Securities and Exchange Commission (SEC) nor any other federal or state agency has approved, determined the accuracy, or confirmed the adequacy of this article.
The views and opinions expressed herein are those of the author and do not necessarily reflect the views of Alpha Architect, its affiliates or its employees. Our full disclosures are available here. Definitions of common statistics used in our analysis are available here (towards the bottom).
Join thousands of other readers and subscribe to our blog.