One of the interesting puzzles in finance is that stocks with greater idiosyncratic volatility (IVOL) have produced lower returns (see an earlier post here). This is an anomaly because idiosyncratic volatility is viewed as a risk factor—greater volatility should be rewarded with higher, not lower, returns. Studies such as “Arbitrage Asymmetry and the Idiosyncratic Volatility Puzzle,” which appeared in the October 2015 issue of The Journal of Finance, by Robert Stambaugh, Jianfeng Yu, and Yu Yuan, have provided explanations for the anomaly.
The explanation for why the anomaly persists is that there is “arbitrage asymmetry”—the greater ability and/or willingness of investors to take a long position as opposed to a short position when they perceive mispricing in security. Asymmetry occurs because there are greater risks and costs involved in shorting, including the potential for unlimited losses.
In addition to the greater risks and costs of shorting, for stocks with a low level of institutional ownership, there may not be sufficient shares available to borrow in order to sell short. Because institutions are the main lenders of securities, studies have found that when institutional ownership is low, the supply of stocks to loan tends to be sparse. Thus, short selling tends to be more expensive. Furthermore, the charters of many institutions prevent, or severely limit, shorting. And finally, there is the risk that adverse moves can force capital-constrained investors to reduce their short positions before realizing profits that would ultimately result from corrections of mispricing. Importantly, when IVOL is higher, substantial adverse price moves are more likely.
Stambaugh, Yu and Yuan demonstrate that the IVOL effect is significantly negative (positive) among the most overpriced (underpriced) stocks and the negative effect among the overpriced stocks is significantly stronger—the negative highest-versus-lowest difference among the most overpriced stocks is 3.7 times the magnitude of the corresponding positive difference among the most underpriced stocks. They also found that the vast majority of the differences in returns were explained by the short side (the most overpriced stocks). In addition, IVOL increased monotonically moving across deciles from the most underpriced to the most overpriced.
Moreover, consistent with their model, they found that the negative IVOL effect among overpriced stocks is stronger for stocks that are less easily shorted (as proxied by stocks with low institutional ownership). The authors also found that while the IVOL effect was strongest among overpriced small stocks—consistent with small stocks being more difficult/expensive to short than large stocks—the effect holds for large stocks as well, though it’s no longer statistically significant at conventional levels.
Also of interest was that they found the average negative relation between IVOL and expected return is stronger in periods when there is a market-wide tendency for overpricing (when investor sentiment is high).
New Evidence on Idiosyncratic Volatility
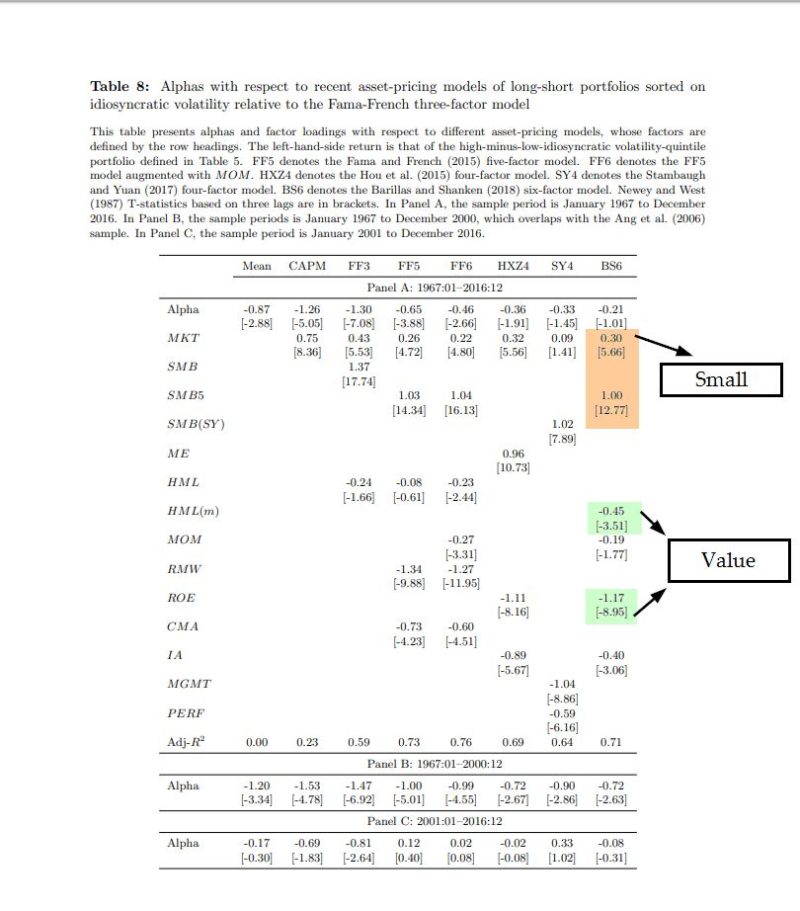
Andrew Detzel, Jefferson Duarte, Avraham Kamara, Stephan Siegel, and Celine Sun contribute to the literature on the IVOL anomaly with their May 2019 study “The Cross-Section of Volatility and Expected Returns: Then and Now.” Their study updated prior research by extending the data sample to begin in July 1926 and end in 2016. In addition, they benchmark returns against newer asset pricing models: The Fama-French five-factor model (market beta, value, size, profitability, and investment); a Fama-French six-factor model which adds momentum; and the four-factor q-model of Hou, Xue, and Zhang (market beta, size, profitability and investment); the four-factor mispricing model of Stambaugh and Yuan; and the Bayesian six-factor model of Barillas and Shanken that is updated monthly.
The following is a summary of their findings:
- The difference in abnormal returns between stocks with high and low IV decreases but remains significant out-of-sample.
- The newer Fama-French five- and six-factor and Q-factor models do not resolve the IVOL anomaly found in prior research. However, the four-factor model of Stambaugh and Yuan and the six-factor model of Barillas and Shanken resolve the anomaly out-of-sample and over the extended period of 1967 to 2016. They also eliminate the arbitrage asymmetry that Stambaugh, Yu, and Yuan proposed as an explanation of the IVOL anomaly.
- An explanation for why the returns of high IVOL stocks are so low is that they tend to behave like small-cap growth stocks with low profitability and high levels of real investment (which have very poor returns).
Conclusion
The research findings not only help us to understand the role that idiosyncratic volatility plays in explaining returns. For investors, it’s important to note that the findings from this research don’t necessarily imply that a fund manager has to short an overpriced stock to benefit. The fund can benefit by avoiding the purchase of overpriced stocks with a filter that screens out stocks with the characteristics creating the mispricing (i.e. negative screens).
Passively managed long-only mutual funds (and ETFs) can put this knowledge to work by using screens to eliminate stocks that would otherwise be on their eligible buy list.
About the Author: Larry Swedroe
—
Important Disclosures
For informational and educational purposes only and should not be construed as specific investment, accounting, legal, or tax advice. Certain information is deemed to be reliable, but its accuracy and completeness cannot be guaranteed. Third party information may become outdated or otherwise superseded without notice. Neither the Securities and Exchange Commission (SEC) nor any other federal or state agency has approved, determined the accuracy, or confirmed the adequacy of this article.
The views and opinions expressed herein are those of the author and do not necessarily reflect the views of Alpha Architect, its affiliates or its employees. Our full disclosures are available here. Definitions of common statistics used in our analysis are available here (towards the bottom).
Join thousands of other readers and subscribe to our blog.