This article discusses the research surrounding style factor ETFs, specifically the effects of portfolio construction on their performance.
The Effects of Portfolio Construction on the Performance of Style Factor ETFs or How to Build a Style Factor ETF That Does What It Says
- Jason MacQueen
- Journal of Portfolio Management
- A version of this paper can be found here
- Want to read our summaries of academic finance papers? Check out our Academic Research Insight category
What are the research questions on style factor ETFs?
Every once in a while it’s effective to challenge the deep-seated ideas that have been utilized to construct your portfolio. Here at Alpha Architect continuously study the literature and conduct research to derive what we believe gives investors the best shot at winning over the long-haul. This article challenges our preference for the equal-weight methodology, which ensures base-line diversification and avoids optimization. But what about optimization? Why equal-weight? Seems too simple. Within that context, the study was designed to determine how well a single factor ETF actually captured the associated factor risk premium and how well it performed against a benchmark. Five single factor portfolios were built using the Northfield XRD risk model defined as 12-month trailing dividend yield; Growth = five-year trend and momentum of EPS, BPS and SPS; Value = BP, E/P, CF/P; 12-month return to 1 month ago return; Quality: ROA, ROE, CF/S. Stocks in the SP500 were ranked from high to low on each factor and the top 100 were selected on the basis of their exposure to the factor. Factor returns were estimated separately from other factors using the Northfield XRD risk model via a cross-sectional regression on a large sample of US stocks.
- How are ETF portfolios typically constructed?
- Is there a better way? Why not optimize?
- How do the portfolio construction methods perform? Which method is best?
What are the Academic Insights?
1. Almost all commercial ETFs utilize practical methods of portfolio construction, including:
- attribute-weighted (AW), where each stock is weighted in proportion to its factor score;
- capitalization-weighted (CW), where stock is weighted in proportion to its market capitalization;
- equal-weighted (EW), where each stock in an N stock portfolio has a weight of 1/N;
- inverse volatility-weighted (IV), where each stock is weighted in proportion to the inverse of its annualized total standard deviation; and
- risk parity-weighted (RP), where each stock is weighted in proportions such that each holding makes the same contribution to the portfolio’s overall risk.
2. While these 5 methods are intuitive and certainly sufficient to achieve a speedy solution, they are not guaranteed to be optimal in terms of trading off expectations of risk and return so that an efficient portfolio is created. Nor are they suited to minimizing unwanted sector or other factor bets in a portfolio that are likely to detract from performance. The authors compare the 5 heuristic methods to 2 optimization approaches: a simple Markowitz-style (MK) and Smart Portfolio Optimization (SPO). SPO is designed to compensate for the drawbacks encountered when applying simple mean-variance optimization. A detailed description of SPO can be found in the paper. Optimization is criticized because it often gives counterintuitive results and unless constrained will tend to try and trade every portfolio holding. Specifically, with respect to factor-based ETFs, optimization presents communication issues for the fund issuer. It is much easier to sell a simple story of an equal-weighted scheme to potential investors. Although beyond the scope of this review, smarter optimization techniques are available commercially and adequately described in the academic and practitioner literature.
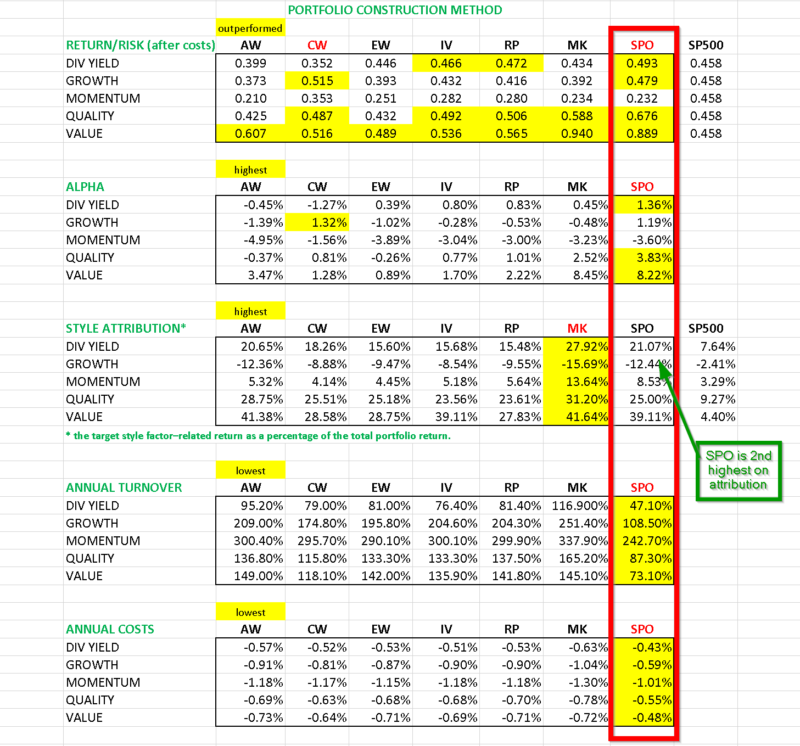
3. OPTIMIZATION. The 7 methods are used to construct 5 single factor strategies including DIVIDEND YIELD, GROWTH, MOMENTUM, QUALITY, and VALUE. Each portfolio is assessed on numerous metrics including but not exclusively: return/risk, transactions costs, turnover, alpha generation, risk control or tracking error, and degree of factor return as a percentage of total return. From the analysis presented on each of the single factor strategies, I have constructed a composite table to illustrate performance metrics for each strategy in an easy-to-read summary. The values highlighted are meant to indicate the “best in class”. From the table it is obvious that the optimization methods, especially SPO, are vastly superior to the heuristic methods on all counts. Some highlights: (1) Return/Risk: While each construction method has its merits in terms of the return to risk ratio specific to one or two of the factors, SPO is the clear winner when compared to the return/risk payoff for the SP500 benchmark; (2) Alpha: the largest values of excess return were found for SPO across all factors with the exception of Growth; Value produced the largest positive alphas regardless of construction method, although optimization methods produced alpha at roughly 3x the rate of heuristic methods; (3) Costs and Turnover: Again SPO turned in significantly lower numbers; (4) Attribution: Both optimization and AW methods were best suited to producing the highest values on the proportion of total return attributed to the factor. This deficiency associated with heuristic weighting schemes is underappreciated. Factor strategies are commonly constructed to obtain an exposure to one, (OK, maybe two factors). However, risk models in commercial use could have 10 or more fundamental risk factors and academic risk models could have 3 at the very least. Under those conditions, a portfolio constructed to align with only one factor are likely to contain unintended exposures to many other factors. Whether those unintended exposures are bets either for or against other factors, in combination they may be of sufficient magnitude to outweigh the performance of the intended factor bet.
Why does it matter?
Building successful factor strategies is not only dependent on choosing the correct factor metric and the correct factor stock, but is also dependent on the methodology used to construct the factor portfolio. In order to build on “factor picking skill”, managers must have a design scheme that not only maximizes skill but eliminates unintended biases that could detract from performance relative to a benchmark.
I really liked this study and think that it is long overdue. I hope it is not underappreciated. For some added robustness I’d consider running the test for longer periods dating back decades instead of limiting the period to just before the great financial crisis to the present. Full disclosure: the author is an employee at Northfield.
The most important chart from the paper
The results are hypothetical results and are NOT an indicator of future results and do NOT represent returns that any investor actually attained. Indexes are unmanaged, do not reflect management or trading fees, and one cannot invest directly in an index.
Abstract
Most style factor exchange-traded funds (ETFs) use some simple heuristic method of portfolio construction, such as equal weighting or capitalization weighting. This inevitably results in inefficient portfolios that are likely to have significant unintended factor bets, and the returns to these can easily dominate the returns to the chosen style factor. The author uses a simple stock selection rule to create different style factor ETFs using a number of heuristic portfolio construction methods, including equal weighting, capitalization weighting, attribute weighting, inverse volatility, risk parity, and Markowitz optimization. The author also introduces a modified version of Markowitz optimization that identifies the most inefficient holdings in an existing portfolio and only allows limited trading in those stocks; the purpose is to gain a significant improvement in overall efficiency without too much turnover. Each of the strategies is rebalanced quarterly from the beginning of 2006 to 2019. Because the stock selection is always the same, the resulting differences in performance and turnover are due entirely to the different methods of portfolio construction.
About the Author: Tommi Johnsen, PhD
—
Important Disclosures
For informational and educational purposes only and should not be construed as specific investment, accounting, legal, or tax advice. Certain information is deemed to be reliable, but its accuracy and completeness cannot be guaranteed. Third party information may become outdated or otherwise superseded without notice. Neither the Securities and Exchange Commission (SEC) nor any other federal or state agency has approved, determined the accuracy, or confirmed the adequacy of this article.
The views and opinions expressed herein are those of the author and do not necessarily reflect the views of Alpha Architect, its affiliates or its employees. Our full disclosures are available here. Definitions of common statistics used in our analysis are available here (towards the bottom).
Join thousands of other readers and subscribe to our blog.