Historical Returns of the Market Portfolio
- Ronald Doeswijk, Trevin Lam and Laurens Swinkels
- The Review of Asset Pricing Studies, 2019
- A version of this paper can be found here
- Want to read our summaries of academic finance papers? Check out our Academic Research Insight category
What are the Research Questions?
This paper complements Doeswijk, Lam, and Swinkels’ 2014 paper, which documents the historical composition of the market portfolio. Doeswijk, Lam, and Swinkel stopped their research in building the “market portfolio,” but left the work of the market portfolios historical returns undone. In this post, the original authors pick up where they left off and work on finding the returns of the market portfolio they had previously identified. The market portfolio, all assets held by financial investors around the globe, is comprised of ten market-capitalization-weighted asset classes organized in five asset class categories: equities (public equities and private equity(1)), government bonds (government bonds, inflation-linked bonds, and emerging market bonds), non-government bonds (investment grade credits, high yield, and leveraged loans), real estate, and commodities. (see here for a discussion from Jon Seed on the Global Market Portfolio).
The authors ask the following questions:
- What is the average compound real return and standard deviation for the global market portfolio from 1960 to 2017?
- What is the average compound real return of the global market portfolio during expansions and recessions?
- What is the average compound real return of the global market portfolio during inflationary and deflationary periods?
What are the Academic Insights?
By constructing a total return series (gross of transaction costs, taxes and management fees), the authors find:
- The global market portfolio realizes an average compounded real return of 4.45%, with a standard deviation of annual returns of 11.2% from 1960 until 2017, gross of trading costs, taxes, and/or management fees. The arithmetic average real return of the market portfolio is 5.05%.
- The average annual real return of the market portfolio in expansions is a statistically significant 9.68 percentage points higher than the return in recessions.
- In the inflationary period from 1960 to 1979, the average real return is 2.77 percentage points below the return in the disinflationary period from 1980 to 2017, but this gap is statistically insignificant.
Why does it matter?
This study is interesting because of the following:
- The market portfolio is relevant for studying financial markets, in the sense that the market portfolio reflects the entire opportunity set of investors
- The market portfolio matters for asset pricing studies
- It is an estimate of the average return that financial investors have potential achieved since 1960
The Most Important Chart from the Paper:
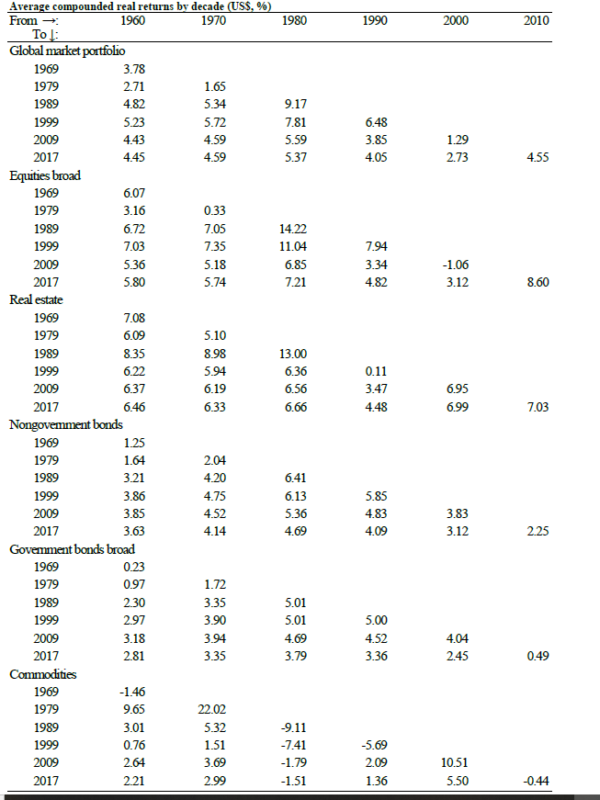
The results are hypothetical results and are NOT an indicator of future results and do NOT represent returns that any investor actually attained. Indexes are unmanaged, do not reflect management or trading fees, and one cannot invest directly in an index.
Abstract
We create an annual return index for the invested global multiasset market portfolio. We use a newly constructed unique data set covering the entire market of financial investors. We analyze returns and risk from 1960 to 2017, a period during which the market portfolio realized a compounded real return in U.S. dollars of 4.45%, with a standard deviation of annual returns of 11.2%. The compounded excess return was 3.39%. We publish these data on returns of the market portfolio, so they can be used for future asset pricing and corporate finance studies.
About the Author: Wesley Gray, PhD
—
Important Disclosures
For informational and educational purposes only and should not be construed as specific investment, accounting, legal, or tax advice. Certain information is deemed to be reliable, but its accuracy and completeness cannot be guaranteed. Third party information may become outdated or otherwise superseded without notice. Neither the Securities and Exchange Commission (SEC) nor any other federal or state agency has approved, determined the accuracy, or confirmed the adequacy of this article.
The views and opinions expressed herein are those of the author and do not necessarily reflect the views of Alpha Architect, its affiliates or its employees. Our full disclosures are available here. Definitions of common statistics used in our analysis are available here (towards the bottom).
Join thousands of other readers and subscribe to our blog.