In his famous 1981 paper, “The Relationship Between Return and Market Value of Common Stocks,” Rolf Banz found that small firms have higher risk-adjusted returns than large firms. This was one of the first major challenges to the capital asset pricing model (CAPM) and market efficiency in general. However, its failure to generate statistically significant premiums post-publication has called into question the premium’s existence.
In their 2018 study, “Fact, Fiction, and the Size Effect,” (Summary) Ron Alquist, Ronen Israel, and Tobias Moskowitz, members of the research team at AQR Capital Management, concluded that there is no strong empirical evidence to support a size premium. However, they did add that size can be an important factor for explaining mutual fund returns and that other factors, such as value, tend to be more powerful among smaller stocks—which is not supportive of there being a small-cap versus large-cap effect but might be a reason to overweight small-cap stocks in long-only constrained factor portfolios. Extending the 2018 Journal of Financial Economics paper, “Size Matters, if You Control Your Junk,” by Clifford Asness, Andrea Frazzini, Ronen Israel, Tobias Moskowitz, and Lasse Pedersen, they then “saved” the size effect by demonstrating that it is made much stronger (and implementation costs are reduced) when size is combined with the newer common factors of profitability, quality and defensive (low beta). Alquist, Israel, and Moskowitz noted:
“Controlling for quality resurrects the size effect after the 1980s and explains its time variation, restores a linear relationship between size and average returns that are no longer concentrated among the tiniest firms, revives the returns to size outside of January and simultaneously diminishes the returns to size in January—making it more uniform across months of the year, and uncovers a larger size effect in almost two dozen international equity markets, 30 where size has been notably weak. These results are robust to using nonmarket-based size measures, making the size premium a much stronger and more reliable effect after controlling for quality.”
The above findings are consistent with those of Mikheil Esakia, Felix Goltz, Ben Luyten and Marcel Sibbe, authors of the study “Size Factor in Multifactor Portfolios: Does the Size Factor Still Have Its Place in Multifactor Portfolios?” (Summary) published in the Winter 2019 issue of The Journal of Index Investing. They concluded: “Our results suggest that the size factor improves model fit, delivers a significant positive premium in the presence of other factors, and contributes positively to the performance of multifactor portfolios. Omitting the size factor has substantial cost to investors, which often exceeds that of omitting other popular factors.” They also observed that size is included as an explanatory factor in all major asset pricing models (three-, four-, five- and q-factor). Confirming their conclusion, in their 2015 study “A Five-Factor Asset Pricing Model,” Eugene Fama and Ken French found that spanning regression tests on the size factor produces reliable intercepts with respect to the other factors, suggesting it has explanatory power over returns not captured by them.
New Research
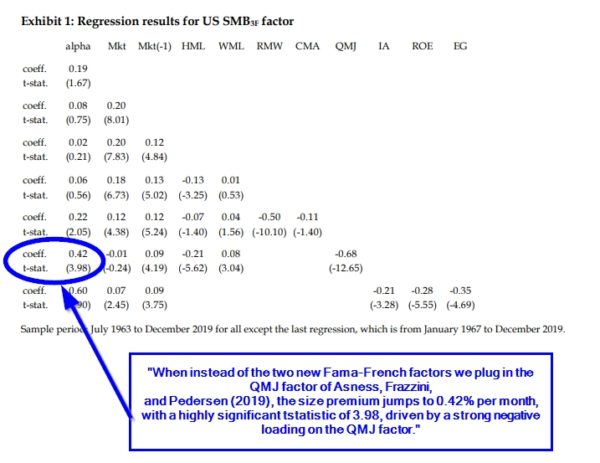
David Blitz and Matthias Hanauer contribute to the literature on the size premium with their September 2020 paper “Settling the Size Matter.” For the U.S. their data sample covered the period July 1963 to December 2019 (Fama-French/AQR data) or January 1967 to December 2019 (q-factor data), which are the longest periods for which all the required data series are available. They also considered international samples, with data from July 1990 to December 2019 (Fama-French data) or July 1993 to December 2019 (AQR data). All portfolios are capitalization weighted, and all returns are in U.S. dollars. Following is a summary of their findings, which are consistent with the papers discussed above:
- The U.S. size premium was 0.19% per month with a t-statistic of 1.68, weakly significant at the 10% confidence level. However, this size premium drops to an insignificant 0.08% after adjusting for market beta exposure.
- The U.S. size premium remained absent when additionally controlling for the classic value and momentum factors, but jumped to 0.22% per month (t-stat = 2.06) when adding the new Fama-French factors of profitability and investment. The main driver of this boost was a highly significant negative loading on the profitability factor, RMW (which is highly correlated with the quality factor, QMJ, from the 2018 paper “Quality Minus Junk” by Clifford Asness, Andrea Frazzini and Lasse Pedersen).
- Replacing profitability with the QMJ factor resulted in a highly significant 0.42% per month size premium (t-stat = 3.98), driven by a strong negative loading on the QMJ factor. This confirms the AQR conclusion of restoring the size premium when controlling for junk. Even stronger results were found when using the q-factor model.
- For international stock markets, size also loads negatively on quality factors, and the size premium improves once controlling for quality, though it remains statistically indistinguishable from zero.
- In the U.S. the added value of SMB in time-series regressions is entirely driven by the short side of quality factors. There is no size premium when controlling for the long side of quality factors.
Despite these findings, like the authors of the previously mentioned studies, Blitz and Hanauer concluded:
“This result does not imply that investors should generally strive for size neutrality, in particular when it comes to long-only factor strategies. … The fact that other factors, such as value, tend to be stronger in the small-cap space may justify a structural overweight in small-cap stocks even if the size premium itself is zero.”
They added:
“Thus, a tilt towards small-cap stocks in long-only factor strategies can serve as a powerful catalyst for unlocking the full potential of these other factors.”
They concluded:
“For long-only investors, this means that an overweight in small-cap stocks may be desirable even if there is no size premium because small-cap stocks can serve as a powerful catalyst for unlocking the full potential of other factors, such as value and momentum. The higher expected return from targeting other factors in the small-cap space has to be balanced against the systematic risk that comes along with small-cap exposure, in particular the risk of small-cap stocks, in general, lagging the capitalization-weighted index by a substantial amount or for a prolonged period of time.”
Having reviewed the research findings, we can also review the evidence from live, systematic small-cap mutual funds—the true test of a realizable size premium.
Implementation: Does the Size Effect Survive Transaction Costs?
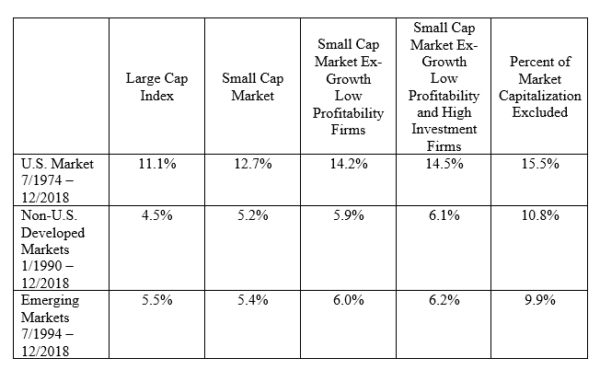
Based on their research, Dimensional uses screens in its fund construction rules to eliminate lottery and “junky” stocks (that is, penny stocks, recent IPOs, stocks in bankruptcy, and small stocks with high investment and low profitability). In addition, since 2013 Dimensional has incorporated screens for profitability. It added a screen for high investment in 2019. The table below shows the simulated returns to each market category. Note how exclusions improve returns.
By reviewing the results of Dimensional’s small-cap funds, we can determine if there has still been a small-cap premium, controlling for junk (and profitability), that investors could have captured, not only in the U.S. but also in developing and emerging markets.
So that we can use all live funds, we will examine the more than 21-year period from January 1999 through August 2020(1).
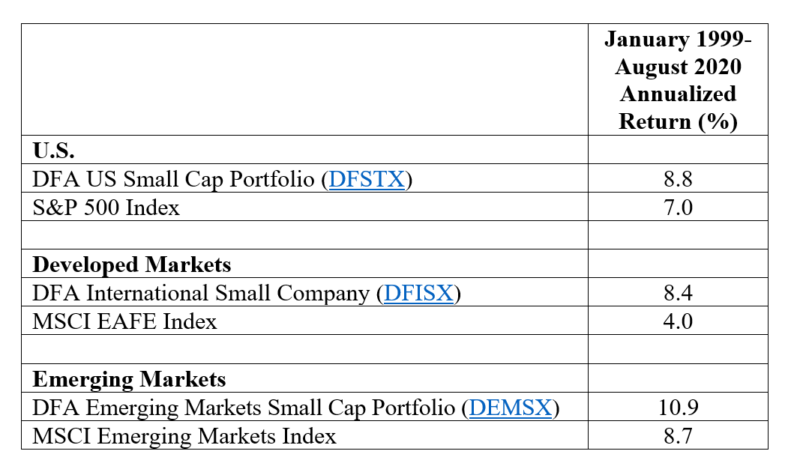
For the more than the 21-year period from January 1999 through August 2020, in each case there was an annualized size (small) premium, ranging from 1.8% to as much as 4.4%. These results are over the period where supposedly the size premium had disappeared (though in “Size Matters, if You Control Your Junk,” the authors do show slight improvement in the post-2000 period relative to the initial period after Banz published his paper), but importantly, these results were after screens that attempt to eliminate small, junky stocks. These results were net of not only expense ratios but all implementation costs, while index returns do not include any costs that are incurred by live funds. Long live the size premium (controlling for junk)!
About the Author: Larry Swedroe
—
Important Disclosures
For informational and educational purposes only and should not be construed as specific investment, accounting, legal, or tax advice. Certain information is deemed to be reliable, but its accuracy and completeness cannot be guaranteed. Third party information may become outdated or otherwise superseded without notice. Neither the Securities and Exchange Commission (SEC) nor any other federal or state agency has approved, determined the accuracy, or confirmed the adequacy of this article.
The views and opinions expressed herein are those of the author and do not necessarily reflect the views of Alpha Architect, its affiliates or its employees. Our full disclosures are available here. Definitions of common statistics used in our analysis are available here (towards the bottom).
Join thousands of other readers and subscribe to our blog.