Part 2: From understanding factors to solving investor problems
In Part 1, we defined fixed income factors. But factors alone will not solve each investor’s problem. Below, we extend the discussion by walking through a case study that shows how an asset allocator might use factors to solve a common problem: how to invest in a low yield environment given the practical constraints faced by many investors. Or, how can factors help investors stuck between a rock and a hard place?
The Investor Problem
Figure 2 shows a hypothetical allocator’s initial fixed income allocation before the precipitous decline in yields in early 2020 – a 100% allocation to the Bloomberg Barclays US Aggregate Bond index. This allocator was constrained because she could not simply reduce the fixed income allocation as yields declined but also could not stomach the potentially low returns associated with a 1% yield on the bond portfolio. To target a yield greater than 2%, the investor added a 20% allocation to the iBoxx High Yield Index – willing to take on increased correlation to equities to achieve more yield. The investor was still concerned about exposure to the lowest credit quality bonds (B, CCC and below) but felt it was necessary to accept this risk to add yield. At the time of the reallocation (in May 2020), the bond portfolio yielded just over 2.5%.
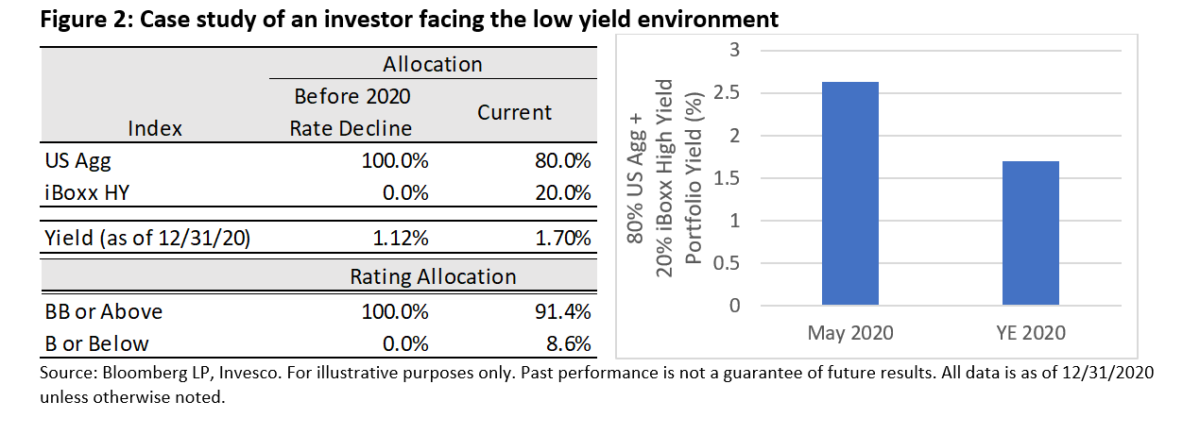
Fast forward a year, and the portfolio has appreciated as yields have declined. It now yields 1.70%. How can fixed income factors help the allocator increase yield without increasing exposure to high yield, and in particular, without increasing her allocation to the lowest credit quality parts of the high yield market (B and CCC)?
Building a Proxy for a High Yield Factor Strategy
We build a simple, factor-based proxy for a high yield strategy to examine the impact that factors can make on this portfolio. The proxy is overweight the factor bonds mentioned above since they have tended to deliver higher returns than the broad market. Figure 3 shows the allocation of factor bonds in a hypothetical factor strategy with similar exposures to the two types of factors: risk-on factors (carry and value) and the risk-off factor (low volatility)(1).
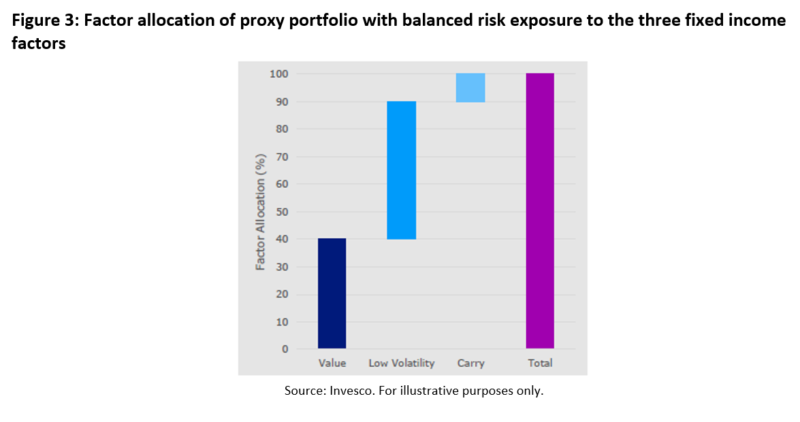
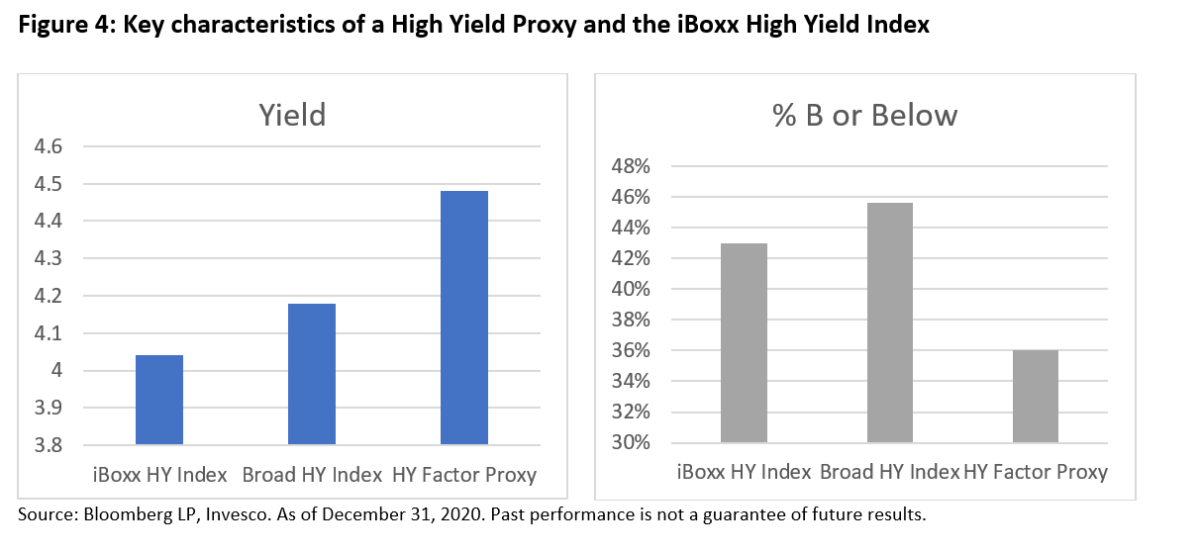
This allocation tends to lead to a portfolio with higher credit quality (due to its exposure to low volatility) and higher yield potential (due to its exposure to carry and value) relative to the broad market or other passive high yield indices. Figure 4 shows the wider yield and lower allocation to Single-B and lower-rated bonds in the High Yield Factor Proxy which is driven by the allocation in Figure 3.
How can this allocation to factors help solve our investor’s problem?
Figure 5 shows the yield pick-up achieved by switching from the iBoxx High Yield Index to the factor proxy. The portfolio’s yield increases by nine basis points. This increase is due to the higher yield of the factor proxy, which is driven by value and carry bonds, and which helps to reach the allocator’s target. The allocation to the lowest credit quality components of the universe decreased due to a higher allocation to higher credit quality (BB), low volatility securities.
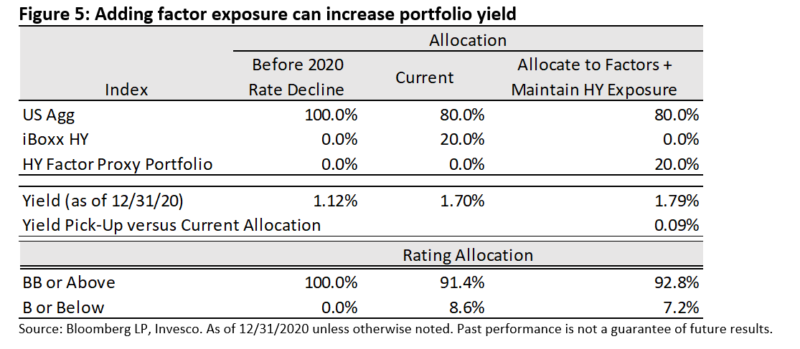
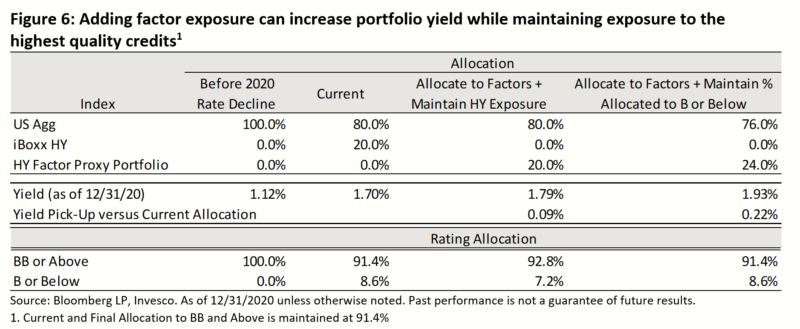
Figure 6 shows how the high yield factor strategy helped the allocator maintain her exposure to bonds rated B or below, while increasing her overall high yield allocation (implicitly adding BB high yield bonds) since it has a lower allocation to the lowest quality securities (B and below). Note that this brings the allocator within seven basis points of her 2% yield target without increasing her exposure to the lowest credit quality securities.
The results are hypothetical results and are NOT an indicator of future results and do NOT represent returns that any investor actually attained. Indexes are unmanaged, do not reflect management or trading fees, and one cannot invest directly in an index.
Are factors a panacea?
Unfortunately, factors are not a panacea. Like any active strategy, a factor-based high yield strategy has the potential to outperform due to its exposure to the factors which have tended to outperform. However, factor-based strategies will NOT outperform all the time. Figure 7 shows the spread of the high yield corporate bond market between 2006 and 2020. We utilize this spread to define the sell-off and recovery periods during three key cycles – the Global Financial Crisis (GFC), the oil price declines between 2015-2017, and the COVID-19 pandemic. The sell-off period is the time within each cycle when spreads rose from normal trading levels to their widest level. The recovery periods are when spreads declined from their widest point to normalized levels. The sell-off periods are shown in blue and the recovery periods are in purple.
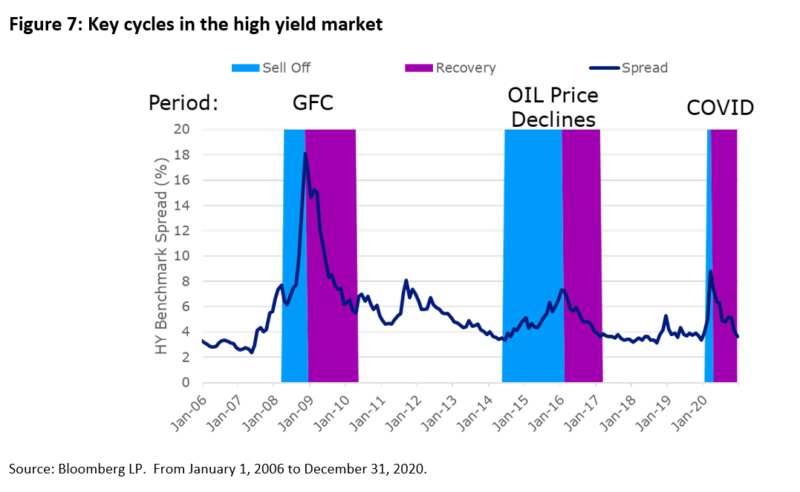
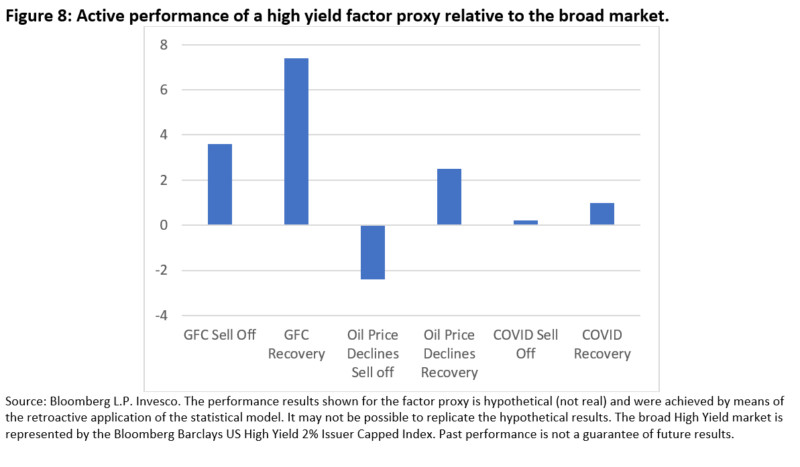
Figure 8 shows the active performance of the high yield factor proxy relative to the broad market(2)
During the sell-off and recovery periods of the GFC cycle, the high yield factor proxy outperformed, driven by the strong relative performance of low volatility during the sell-off and the strong outperformance of value and carry during the ensuing recovery.
During the oil price decline cycle of 2014 and 2015, the high yield factor proxy underperformed the broad benchmark. This is an example of the high yield strategy not being a panacea. This is a period in which one might question the value of the factor strategy. Investors who stayed the course, however, would have been rewarded with significant appreciation as oil prices recovered.
During the COVID-19 cycle, including the sell-off and recovery, the factor-based high yield strategy has performed generally in line with the benchmark.
Examining these specific periods illustrates that, while factors can potentially help fixed income portfolios over long periods of time and can be used in portfolio construction to better understand its overall characteristics and exposures, they may not offer better performance over every period or cycle.
Conclusion
The problem with being caught between a rock and a hard place is that there are often no clear-cut solutions. But there are often ways to drive incrementally better outcomes. If enough incremental improvements are combined, they can potentially form the solution. We believe fixed income factors have the potential to deliver such incremental improvements to investment performance and help investors achieve better outcomes.
Fixed income factors are not an ivory tower, theoretical concept, in our view. Rather, they are a new, valuable tool in the investor toolbox to help solve real problems associated with fixed-income allocations. Considering that fixed income has never been more challenging as allocators face some of the lowest yields they have ever seen, the timing around this advancement could not be more welcome.
References[+]
| ↑1 | This allocation is based on the following rationale: We have chosen an equal balance between risk-on and risk-off factors to produce a portfolio with a total level of risk in line with the broad universe. Half of the factor exposure is to higher-yielding, risk-on factors (carry and value) while the other half is allocated to the lower-yielding, risk-off factor (low volatility). A less balanced portfolio would be higher/lower risk than the overall universe, depending on whether it was tilted toward value/carry (higher risk) or low volatility (lower risk). We chose a 10% allocation to carry and a 40% allocation to value since carry tends to have higher volatility than value. So while the capital allocation to value is higher, the risk allocation is similar between carry and value. |
|---|---|
| ↑2 | Performance does not include frictional costs like transaction costs or bid/offer spreads. |
About the Author: Ward Bortz
—
Important Disclosures
For informational and educational purposes only and should not be construed as specific investment, accounting, legal, or tax advice. Certain information is deemed to be reliable, but its accuracy and completeness cannot be guaranteed. Third party information may become outdated or otherwise superseded without notice. Neither the Securities and Exchange Commission (SEC) nor any other federal or state agency has approved, determined the accuracy, or confirmed the adequacy of this article.
The views and opinions expressed herein are those of the author and do not necessarily reflect the views of Alpha Architect, its affiliates or its employees. Our full disclosures are available here. Definitions of common statistics used in our analysis are available here (towards the bottom).
Join thousands of other readers and subscribe to our blog.