Get Green or Die Trying? Carbon Risk Integration into Portfolio Management
- Maximilian Görgen, Andrea Jacob, and Martin Nerlinger
- Journal of Portfolio Management
- A version of this paper can be found here
- Want to read our summaries of academic finance papers? Check out our Academic Research Insight category
What are the research questions?
In 2015, 197 nations signed onto the Paris Agreement and committed to limiting global warming to less than 2 degrees C above preindustrial levels. Although the arguments are compelling, the drive to manage carbon risk presents quite a challenge for individual investors and portfolio managers. Although ESG investing spans the gamut of environmental issues, the specific case of carbon risk is complex. How do investors align portfolios to fight climate change? How do investors direct their investments toward “green” products? How can the exposure to carbon risk be measured? And if it can be measured, what return contributions are reasonable to expect? In this research, the authors propose a familiar capital-markets approach to measuring and managing carbon risk. They propose the estimation of a “carbon” beta for individual stocks, portfolios, or any financial product. The team’s returns-based approach to calculate the “carbon beta” is simple, established, and eliminates the need to obtain and execute on complicated, expensive data such as carbon emissions.
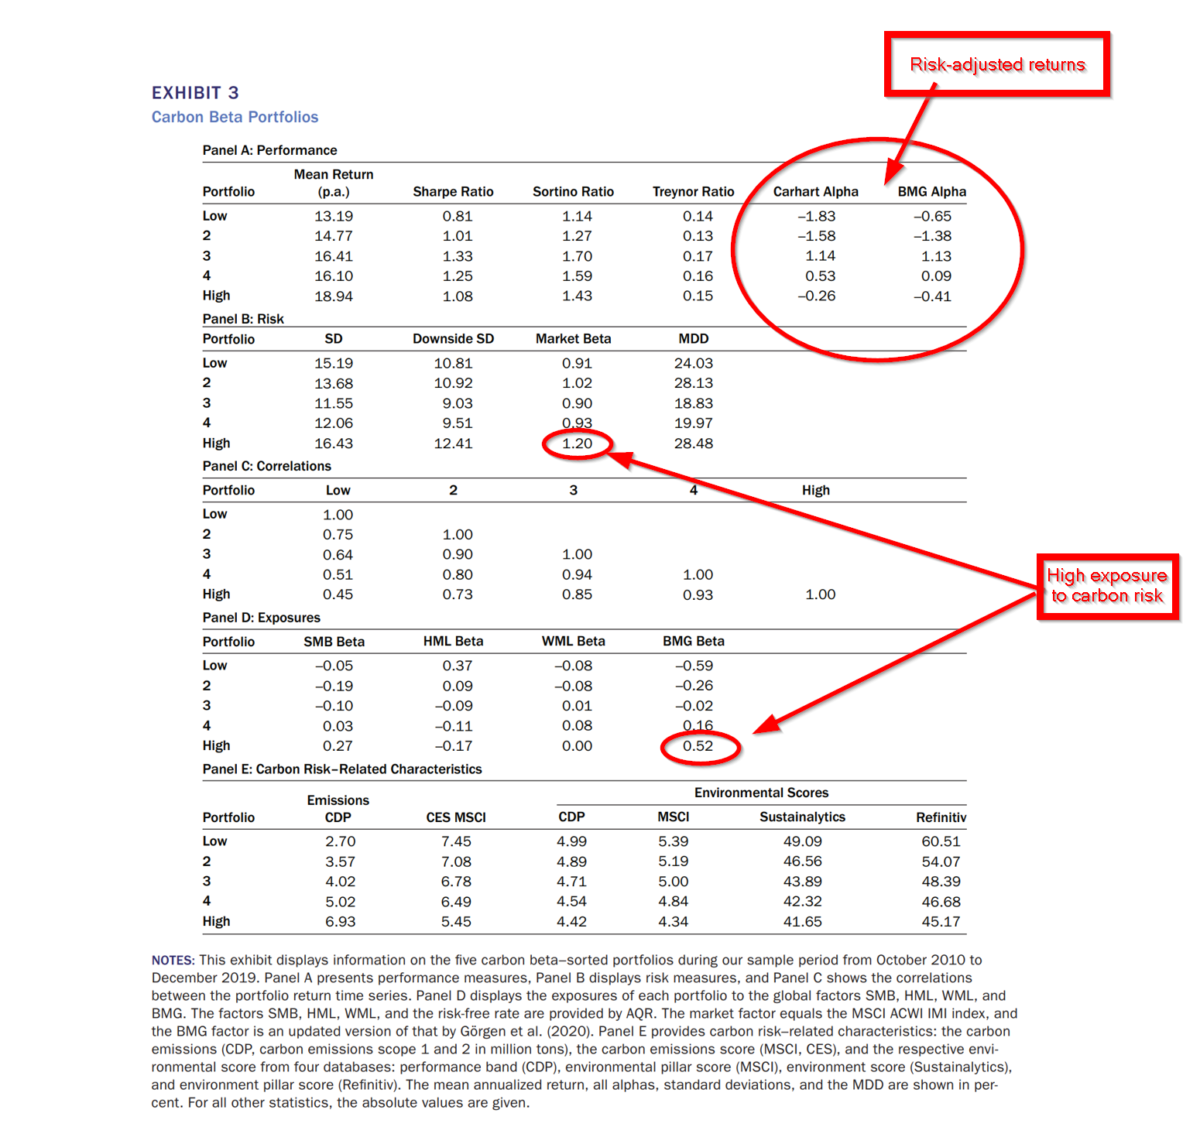
The dataset used includes the constituents of the MSCI ACWI Investable Market Index, consisting of 23 developed markets and 26 emerging markets at all cap levels. Once carbon betas are estimated, quintile portfolios are constructed every quarter from 2010-2019. The 20% lowest carbon beta firms were assigned to Portfolio #1 and the highest carbon beta firms were assigned to Portfolio #5. A return series was then constructed for each of the five portfolios, and the results of the risk/return analysis are presented in Exhibit 3, below. The key questions analysed are as follows:
- What is the “carbon” beta and how is it measured?
- What are the risk and return profiles for various levels of carbon beta?
What are the Academic Insights?
- The carbon beta for stocks or portfolios is estimated consistent with the Carhart (1997) methodology. It is interpreted as the “sensitivity of firms’ stock price to shifts in the climate change-induced process of the economy.” Essentially, the carbon beta reflects the market’s estimate of climate change risk and is consistent with the interpretation of other risk factors in the Carhart model.
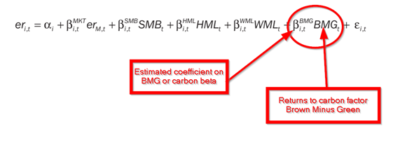
If the carbon beta has a positive sign, that stock or portfolio will be negatively affected if the transition to a low-carbon economy occurs faster, broader, or deeper than expected. If a slower than expected transition were to occur, a positive carbon beta will produce a positive return impact. Clearly, the opposite is true for a negative carbon beta.
2. RETURN PROFILE: There was a monotonically increasing return from 13.19% for Portfolio #1 (low carbon risk) to 18.94% for Portfolio #5 (high carbon risk). However, both Portfolios #1 and #5 returned the lowest Sharpe, Sortino, and Treynor ratios. When the BMG factor in included in the Carhart model, the estimated value of alpha was lower than if the BMG factor was excluded. The alphas were negative for the Carhart model with and without BMG for Portfolios #1, #2, and #5. It seems that the risk-adjusted performance of the most extreme green and brown portfolios was poor. Investors should take note since their risk measures appear to be higher also. The return payoff is disappointing, to say the least.
RISK PROFILE: Measures of total risk (standard deviation, downside standard deviation, and maximum drawdown) all exhibited similar patterns. For example, the standard deviation increased from 15.19% for Portfolio #1 (low carbon risk) to 16.43% for Portfolio #5 (high carbon risk). However, Portfolio #3 exhibited a much lower level of total risk at 11.55%. Systematic risk as measured by beta was high for both extreme portfolios. The carbon beta for Portfolio #5 was 1.20 and 1.02 for Portfolio #2, both much higher than for the remaining 3 portfolios which were in the low .90s. Correlations between the returns of the five quintile portfolios decline monotonically moving from the low carbon quintile to the high quintile portfolio. This result provides at least some evidence that the quintiles differ in terms of their carbon risk exposures. Exposures to traditional factor risks are more interesting. The exposure to Size rises from negative to positive with higher levels of carbon risk, while the Value exposure drops. There was no apparent pattern to the Momentum factor. Most interesting was the pattern in BMG: increasing from a large -.59 exposure for the low carbon risk quintile to a large +.52 for the high carbon risk quintile. A reassuring result that is consistent with expectations given the approach used to estimate carbon exposure in this study. Tests of the carbon beta with other emissions and environmental scores (CDP, CES MSCI, Sustainalytics, Refinitiv) exhibit a consistent pattern. Emissions and scores from several vendors increase steadily from Portfolio #1 to Portfolio #5.
Why does it matter?
The most important takeaway from this research is that the carbon beta as described and estimated in the paper is able to reflect and measure both green risk and brown risk. Investors should be aware of this potential risk/reward element in their portfolios.
From a practical point of view, integrating carbon risk into portfolios and other products requires some due diligence. For example, high and low carbon risk portfolios exhibit different factor exposures. At the green end, the Value and Momentum factors are dominant, while Value and Size are predominant at the brown end. Since the decision to tilt towards one or the other end of the carbon risk spectrum, investors are well-advised to avoid simple measures of carbon risk and examine other sources of information about concurrent risks and expected returns.
The most important chart from the paper
Abstract
Portfolio management is confronting climate change more strongly and rapidly than expected. Risks arising from the transition from a brown, carbon-based to a green, low-carbon economy need to be integrated into portfolio and risk management. The authors show how to quantify these carbon risks by using a capital markets–based approach. Their measure of carbon risk, the carbon beta, can serve as an integral part of portfolio management practices in a more comprehensive way than fundamental carbon risk measures. Apart from other studies, the authors demonstrate that both green and brown stocks are risky per se, but there is no adequate remuneration in the financial market. In addition, carbon risk exposure is correlated with exposures to other common risk factors. This requires due diligence when integrating carbon risk in investment practices. By implementing carbon risk screening and best-in-class approaches, the authors find that investors can gain a desired level of carbon risk exposure, but this does not come without well-hidden costs.
About the Author: Tommi Johnsen, PhD
—
Important Disclosures
For informational and educational purposes only and should not be construed as specific investment, accounting, legal, or tax advice. Certain information is deemed to be reliable, but its accuracy and completeness cannot be guaranteed. Third party information may become outdated or otherwise superseded without notice. Neither the Securities and Exchange Commission (SEC) nor any other federal or state agency has approved, determined the accuracy, or confirmed the adequacy of this article.
The views and opinions expressed herein are those of the author and do not necessarily reflect the views of Alpha Architect, its affiliates or its employees. Our full disclosures are available here. Definitions of common statistics used in our analysis are available here (towards the bottom).
Join thousands of other readers and subscribe to our blog.