Optimal Strategies for ESG Portfolios
- Fabio Alessandrini and Eric Jondeau
- Journal of Portfolio Management
- A version of this paper can be found here
- Want to read our summaries of academic finance papers? Check out our Academic Research Insight category
What are the research questions?
In a 2020 paper, the authors explore the side effects of applying ESG screens to a passive portfolio. While the ESG scores or tilt was improved and Sharpe ratios increased, significant regional, sector, and conventional risk factor exposures were magnified. While investors may be attracted and willing to adopt ESG strategies, they may be unwilling to accept exposures to these additional sources of risk. The question for the portfolio manager is whether or not an improvement in ESG exposures necessitates taking on additional, undesirable risks. Or is there an alternative that satisfies both objectives? That’s basically the question addressed in this article. And you guessed it, the answer is YES. The authors construct a framework for an optimization approach that delivers on all requirements.
For the optimization, the authors first define the objective to maximize the ESG score of the portfolio, while minimizing tracking error, turnover, and keeping exposures to regional, sector, and other risk factors to a specific limit. The optimal portfolio was constructed via the maximization of ESG quality or score. For all optimizations, sector, and Market, SMB, HML risk factors were controlled at +/-5% around the benchmark for regions; +/-2.5% for sectors and risk factors. For example, in the US, the optimization avoided extreme underweighting in energy and overweighting IT that would ordinarily accompany a screening method of construction. The screened portfolio was then constructed by eliminating the bottom/worst 50% of stocks based on ESG scores. The universe consisted of ESG data from MSCI- and MSCI benchmarks for the period 2007-2018.
- In comparison to the pure screening of undesirable (sin) stocks, can an optimization approach deliver better ESG performance relative to a benchmark?
- What about costs in terms of turnover (TO) and tracking error (TE)?
What are the Academic Insights?
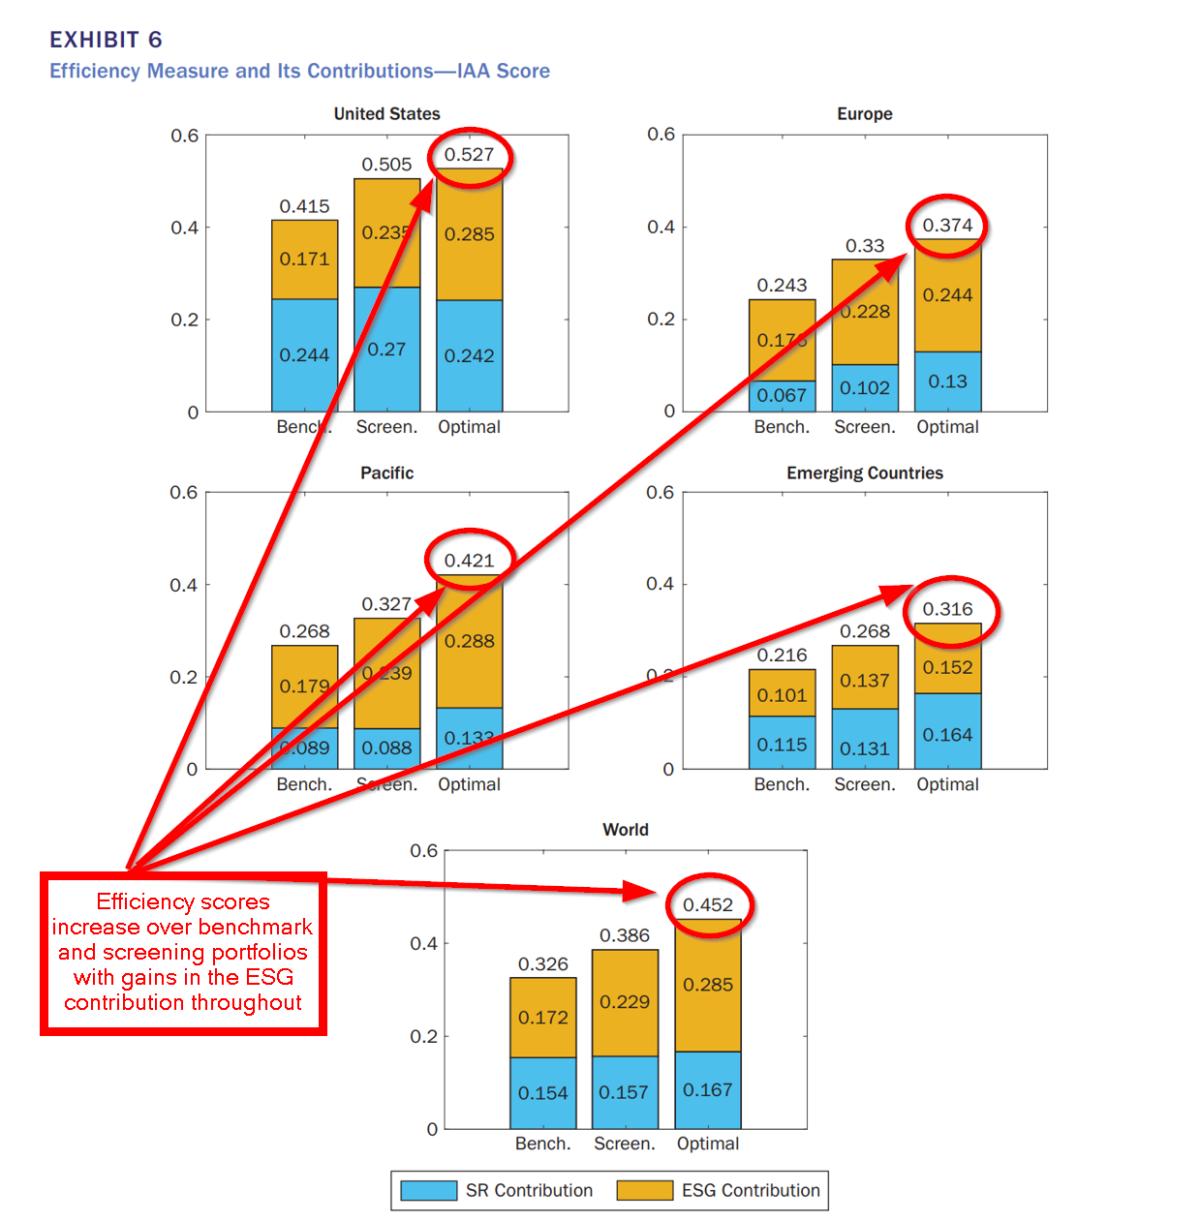
- YES. Shown in Exhibit 6 is a summary of the efficiency of and tradeoff between performance measures and the level of ESG quality in the optimal portfolio, the screened portfolio, and the benchmark. For all four regions and the world set, the efficiency measure of the optimized portfolio improved relative to the screened and benchmark portfolios. For the US, there was a slight reduction in the Sharpe ratio proportion of the efficiency measure, which was offset by a very large increase in the ESG proportion. The ESG score for the optimized portfolio, however, increased to 8.55 from 5.05. For Europe, the ESG score increased to 9.56 from 6.79 and the Sharpe ratio increased two-fold, from .13 to .26. The efficiency measure increased to .37 from .24 and as with the US, the ESG portfolio performance was not due to sector or risk factor exposures but to ESG quality. For the Pacific region, the maximization of the ESG score resulted in an increase to 8.98 from 5.71 and an increase in the Sharpe artio to .27 from .18. Unlike the US and European results, the Pacific region and Emerging Countries (EC), exhibited a significant exposure to the Size (SMB) and Value (HML) factors consistent with the MSCI benchmark. The EC and World universe exhibited similar increases in the ESG scores for the optimized portfolios.
- VERY COSTLY. With respect to the active risk of the screening portfolio at 1.85%, the TE for the optimized portfolio in the US was 2.7%. For Europe, the TE was 2.71% relative to 2.2% for screened portfolios. As to turnover, 94% was clocked for the US optimized versus 65.9% for screened portfolios. In Europe, turnover was similar at 95.9% versus 64.1% for screened portfolios. A different story characterized the Emerging countries, TE was lower than that of the screened portfolio, while turnover was similar. The authors did develop a methodology to include minimization of turnover. The results are presented in Appendix C in the online version of the paper.
Why does it matter?
The results reported here provide empirical evidence that active investment in ESG stocks is quite different, in a fundamental sense, from simply eliminating undesirable stocks based on screening rules. The results also beg the question as to whether a high ESG score is a signal for superior price performance of ESG stocks. Give the short time period investigated conclusions about outperformance would not be warranted, but the effectiveness of the methodology demonstrated in the article still stands. A quote from the authors:
The framework presented in this article allows us to incorporate all of the information in both the ESG scores and risk attributes of the companies to reach the optimal portfolio. It is therefore in the camp of what is often referred to as integration in the field of ESG investing.
The most important chart from the paper
Abstract
Previous research has provided evidence that in the last decade, investing according to screening based on environmental, social, and governance (ESG) criteria would have allowed investors to considerably improve the ESG quality of their portfolio without deterioration of its financial performance. However, a drawback of such a screening process is that it may generate undesirable regional, sectoral, and risk factor exposures. In this article, the authors propose an investment strategy that maximizes the ESG quality of the portfolio while maintaining regional, sectoral, and risk factor exposures within stated limits. They provide evidence that such a portfolio would have produced risk-adjusted performance at least as high as the standard MSCI benchmark for a wide range of ESG criteria and regions over the 2007–2018 investment period
About the Author: Tommi Johnsen, PhD
—
Important Disclosures
For informational and educational purposes only and should not be construed as specific investment, accounting, legal, or tax advice. Certain information is deemed to be reliable, but its accuracy and completeness cannot be guaranteed. Third party information may become outdated or otherwise superseded without notice. Neither the Securities and Exchange Commission (SEC) nor any other federal or state agency has approved, determined the accuracy, or confirmed the adequacy of this article.
The views and opinions expressed herein are those of the author and do not necessarily reflect the views of Alpha Architect, its affiliates or its employees. Our full disclosures are available here. Definitions of common statistics used in our analysis are available here (towards the bottom).
Join thousands of other readers and subscribe to our blog.