Aggregate Confusion: The divergence of ESG ratings
- Florian Berg, Julian F. Koelbel, and Roberto Rigobon
- MIT Working Paper
- A version of this paper can be found here
- Want to read our summaries of academic finance papers? Check out our Academic Research Insight category
What are the research questions?
ESG products have been flooding the market and it is difficult for investors to assess the ground truth. To make matters worse, with limited sample size periods and datasets, trying to determine “evidence-based” ESG insights, is challenging. Nonetheless, we’ve been covering the academic research on ESG investing as much as we can to empower investors through education.
What we’ve found is that one of the biggest challenges in ESG investing is figuring out the best methodology to score ESG rating systems. This article is a straightforward analysis of the degree of disagreement among ESG ratings and the underlying drivers of the disagreement. The confusion that characterizes the ratings obtained from major vendors of ESG data presents a formidable challenge for investors, portfolio managers, and other decision-makers tasked with an ESG mandate. How does one measure the “virtue” of a company, in terms of ESG? The definition of a company’s “virtue” for MSCI will differ from that of RobecoSAM which will differ from KLD, and so on. Since there is no reliable measure of the true “ESG-ness” for a company, the next best thing to do, at this point, is to measure, delineate and clarify the sources of differences in the ratings provided by the vendors themselves.
The data set used in this study was provided by six data vendors (KLD, Sustainalytics, Vigeo Eiris, RobecoSAM, Asset4, and MSCI) and included 709 indicators. With those six providers, the major players in the ESG rating business are well represented and a major portion of the rating market is covered. The vendors provided the rating, underlying indicators, documentation regarding aggregation, and measurement rules for the indicators. The raw data was not provided. The indicators were ultimately classified into 65 categories. Using a variety of quantitative approaches (regression, neural networks) the authors were able to aggregate the indicators and replicate the rating with at least a 79% accuracy and at most a 99% accuracy, depending on the data vendor. This produced an excellent data set to evaluate 2 questions:
- Are ESG ratings provided by major rating agencies really all that different?
- What are the sources of the divergence between firm specific ESG ratings?
What are the Academic Insights?
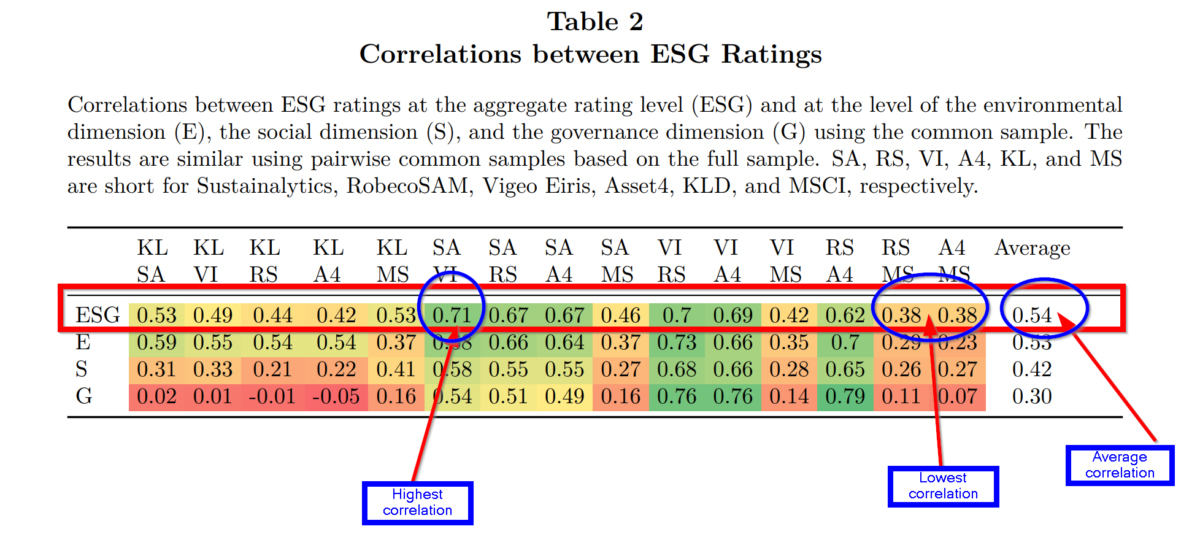
- YES. The divergence in ratings varied by the vendor considerably. Given that the correlation coefficient measures the degree that two variables are similar, the authors find the correlations between ESG ratings obtained from the 6 vendors is substantially low with a wide range of outcomes. The correlations between the aggregate ESG ratings from various providers, and the 3 individual components are presented in Table 2 below. The average correlation among all pairs of data providers for the aggregate ESG rating was .54, with a high of .71 between Sustainalytics (SA) and Vigeo Eiris (VI) and a low of .38 between RobecoSAM/ Asset4 and MSCI/Asset4. The average for the Environment component was .53 with a range of .73 to .23. The average for the Social component was .42 with a range of .68 to .21. For the Governance component, the average was .30, with a range of .79 to -.05.
- The authors propose and analyze 3 sources of divergence in ESG ratings:
- MEASUREMENT: Was found to be the main driver of ratings divergence. It was defined as the situation where one rating may measure an attribute with a specific indicator and another rating measures the same attribute with a different indicator. For example, labor practices could be measured by workforce turnover, labor-related lawsuits, the presence or absence of codes of conduct, frequency of labor-related incidences and so on. Discrepancies in measurement means that the user of ESG ratings must address the issue of what and how an indicator is measured. Therefore, if vendors all agree on a set of indicators (the what), a different metric (the how) would still result in a divergent rating. A rater effect was also documented in the results. Vendors that assign a high score for a company in one category were more likely to assign high scores in all categories. Could this be a result of assigning scoring tasks to analysts based on firm rather than by category? The authors note this structural issue as a likely culprit.
- SCOPE: Was a close second to measurement as a source of ratings divergence. It was defined as the set of attributes on which ratings are based. For example, one rater may include 3 attributes (carbon emissions, labor practices, lobbying) while another may include only 2 of those 3 in a rating. The wide scope of one rating versus others is a source of divergence because it allows for the possibility of differing views of the attributes relevant to an ESG rating. One could argue that divergence in scope is actually a desirable opportunity that is an unavoidable aspect of the ESG rating process.
- WEIGHT: The weighting scheme was found to play a minor role in ratings divergence The weighting scheme referred to the relative importance various raters place on attributes and/or indicators. For example, one rater may assign a greater weight to labor-related lawsuits relative to workforce turnover. The results indicate that resolution of a rating discrepancy between 2 vendors would not be addressed by reweighting the attributes or indicators included in a specific rating.
Why does it matter?
One major takeaway from this research is the finding that the correlation was materially low at .54 and that this value was not driven by extreme observations. Nor was it driven by sector, region, or other company characteristics. However, the differences were driven by companies that scored at the top ranks of ESG ratings. This explains why ESG portfolios constructed using different vendor products have very different constituents. If portfolios are constrained to the top deciles of ESG companies regardless of the vendor, then there will be very few companies included. At least one mystery of ESG portfolios solved?
The most important chart from the paper
Abstract
This paper investigates the divergence of environmental, social, and governance (ESG) ratings. Based on data from six prominent rating agencies—namely, KLD (MSCI Stats), Sustainalytics, Vigeo Eiris (Moody’s), RobecoSAM (S&P Global), Asset4 (Refinitiv), and MSCI—we decompose the divergence into three sources: different scope of categories, different measurement of categories, and different weights of categories. We find that scope and measurement divergence are the main drivers, while weights divergence is less important. In addition, we detect a rater effect where a rater’s overall view of a firm influences the assessment of specific categories.
About the Author: Tommi Johnsen, PhD
—
Important Disclosures
For informational and educational purposes only and should not be construed as specific investment, accounting, legal, or tax advice. Certain information is deemed to be reliable, but its accuracy and completeness cannot be guaranteed. Third party information may become outdated or otherwise superseded without notice. Neither the Securities and Exchange Commission (SEC) nor any other federal or state agency has approved, determined the accuracy, or confirmed the adequacy of this article.
The views and opinions expressed herein are those of the author and do not necessarily reflect the views of Alpha Architect, its affiliates or its employees. Our full disclosures are available here. Definitions of common statistics used in our analysis are available here (towards the bottom).
Join thousands of other readers and subscribe to our blog.