Asset Allocation and Private Market Investing
- Junying Shen, Ding Li, Grace Qiu, Vishv Jeet, Michelle Teng, and Ki Cheong Wong
- Journal of Portfolio Management
- A version of this paper can be found here
- Want to read our summaries of academic finance papers? Check out our Academic Research Insight category
What are the research questions?
Allocations to illiquid assets(1) have become increasingly popular, thus requiring asset managers to consider portfolio-wide liquidity characteristics. Although determining the price of illiquidity is a challenge for investors, the construction of a portfolio that includes liquidity constraints can be even more daunting. Improvised, or other less formal approaches to manage illiquidity, are less than optimal when performance is considered. On one hand, investors could simply ignore the risk of a liquidity crisis and hold illiquid assets in lieu of cash in order to maximize out-performance. The “max it out” approach leaves little or no margin for error in the face of unexpected cash calls. On the other hand, one could hold cash and eliminate the risk of unexpected liquidity calls, a likely detriment to performance.
In modern portfolio theory (MPT) terms, the problem for the investor is to structure the portfolio to maximize utility (performance) while controlling for the impact of severe and/or frequent liquidity calls. In this research, the authors present a framework that incorporates views and assumptions of the allocator regarding risk and returns in the capital markets (both private and public) as well as the manager’s skill at asset selection. The authors consider private assets commitment strategy’s impact on cash flow needs as well as the associated penalties on portfolio performance.
The research questions they address are as follows:
- What is the framework for allocation and optimization?
- What is the desired allocation to private assets?
What are the Academic Insights?
- The framework for allocation contains five components.
- Market Simulation: The objective of the simulation is to generate returns based on the user’s public and private capital market assumptions.
- Private Asset Cash Flow Model: The objective of the model is to generate cash flows based on the user’s assumptions on private asset returns and skill at fund selection.
- LP Commitment Strategies: Although other commitment strategies can be accommodated, two are presented in this analysis. The cash flow matching strategy is designed to construct a private asset portfolios with net zero cash flows. The expectation is that the public assets in the portfolio will be protected. The targeted NAV strategy is designed to maintain a specific percentage NAV allocated to illiquid assets within the portfolio.
- Portfolio Structure: The assumption regarding structure is that users will include assets as preferred by how easy they are to sell to meet a liquidity demand. Assets are assumed to fall into one of three categories: liquid passive assets with no alpha expectation, liquid active assets expected to earn alpha, and illiquid private assets such as buyout funds, mezzanine credit or real estate funds as examples.
- Liquidity Demands, Sources, Events and Severity of Liquidity Events: A liquidity event is defined as one of four categories: GP credit calls; Portfolio rebalancing to maintain target public asset class weights; Tactical moves into higher beta assets made to exploit market dislocations; Tactical moves, after a market recovery, to adjust public assets to regain relative target weights. Liquidity events are also scored as to severity and frequency. Users are able to quantify how portfolio liquidity will change consequent to changes in portfolio structure or commitment strategy. The score is intended to quantify the amount of liquidity associated with a specific asset allocation choice as well as the users view on the severity of a specific liquidity event.
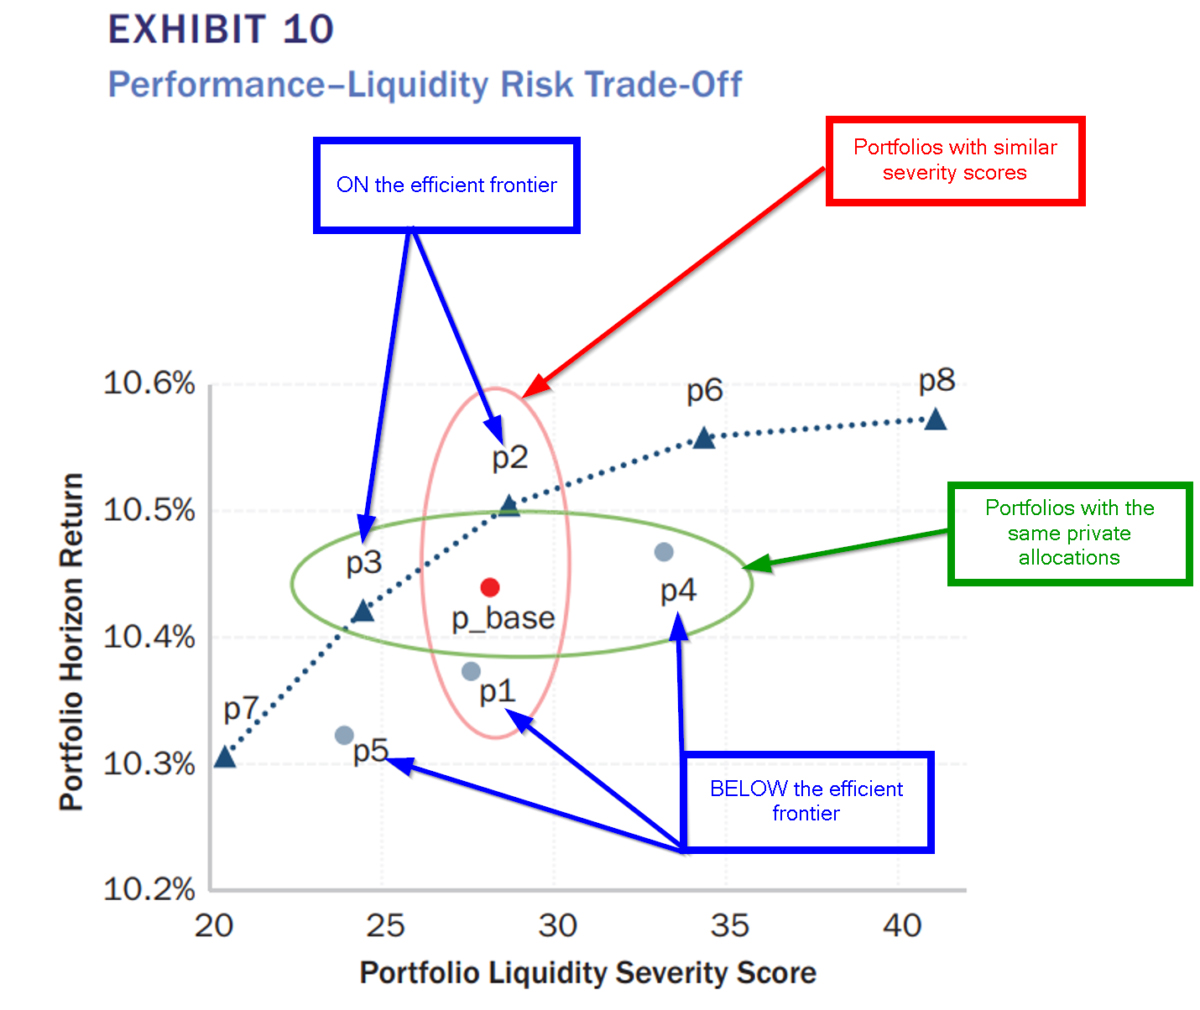
- While a number of case strategies can be analyzed, the authors focus on one NAV strategy for illustrative purposes. The efficient frontier of performance and liquidity risk is presented in Exhibit 10 (provided below) and is specific to the target NAV 1.375 strategy with 9 different allocations from which to choose. That is, NAV is set to a fixed fraction (1.375) of the uncommitted capital. Portfolios 3, 4 and the base portfolio have the same private allocation (green circle), however only portfolio 3 is on the efficient frontier. The improved liquidity associated with portfolio 3 is far superior to portfolio 4 and the base portfolio. An investor interested in reducing liquidity risk at the same private allocation should hold #4. Portfolios 1, 2 and the base have the same severity scores (red circle) but only portfolio 2 is on the efficient frontier. The payoff to liquidity risk is subpar for portfolio 1 and the base portfolio. An investor interested in avoiding the same severe liquidity events while improving performance should hold #2.
Why does it matter?
The distinguishing feature of this article lies in the specific treatment of liquidity events in a quantitative sense. Liquidity events are explicitly modeled in terms of nature, severity, and used as an unambiguous component to be traded off with portfolio performance. In contrast, other work penalizes illiquidity implicitly as a shadow price in the optimization process.
As long as most allocators in the private asset arena fail to model the impact of bottom-up liquidity demands from private asset commitments in the context of top-down asset allocations, managing cash flow is likely to remain problematic. Adopting an optimization approach to quantifying the impact of liquidity events is a reasonable and doable solution.
The most important chart from the paper
Abstract
Investors have been increasing their allocations to private assets, seeking higher returns and better portfolio diversification. However, as this allocation increases, the liquidity characteristics of their portfolios change. The authors create a framework that links bottom-up private asset investing with top-down asset allocation. Private asset cash flows are consistently modeled together with public asset returns and risk that, in turn, drive portfolio construction. This helps investors analyze how allocations to illiquid private assets, in combination with their commitment strategy, may affect their portfolio’s ability to respond to various liquidity demands. By measuring the potential trade-off among asset allocations, total portfolio performance, and the frequency of certain liquidity events with different severities, this framework can help investors quantify the interaction between their portfolio structure and performance and formalize their decision making around portfolio liquidity choices.
About the Author: Tommi Johnsen, PhD
—
Important Disclosures
For informational and educational purposes only and should not be construed as specific investment, accounting, legal, or tax advice. Certain information is deemed to be reliable, but its accuracy and completeness cannot be guaranteed. Third party information may become outdated or otherwise superseded without notice. Neither the Securities and Exchange Commission (SEC) nor any other federal or state agency has approved, determined the accuracy, or confirmed the adequacy of this article.
The views and opinions expressed herein are those of the author and do not necessarily reflect the views of Alpha Architect, its affiliates or its employees. Our full disclosures are available here. Definitions of common statistics used in our analysis are available here (towards the bottom).
Join thousands of other readers and subscribe to our blog.