Carbon Markets Overview
Carbon markets are quickly making their way to the forefront of Environmental, Social, and Governance (ESG) investing, as well as the finance community as a whole. The Kraneshares Global Carbon ETF, (Ticker: KRBN) (whose holdings I’ll dive into shortly) was one of the top 5 performing ETFs in 2021 on a % return basis (1). However, it doesn’t appear that 2021 was a one-hit-wonder for Carbon Markets, but instead, the beginning of a new and very real trend.
Whether we’re analyzing the private sector or the most powerful governments in the world, it’s safe to say that the push for “net-zero emissions” and carbon-friendly policies is one that will continue to crescendo into the latter half of the decade and beyond.
In the private sector, some of the largest companies in the most carbon-intensive industries (from a greenhouse gas emissions perspective) have already publicly declared their net-zero targets. These industries include Oil and Gas (e.g., Shell, BP, Total, Chevron), Utilities (e.g., Engie), Steel (Nippon Steel), Cement / Construction Materials (Holcim, Boral), Automotive (e.g., Ford, General Motors, Volkswagen), and Beverage (e.g., Coca-Cola) (2).
The private sector is not in this endeavor alone. There continues to be a substantial push from the public sector with the most powerful world leaders driving their economies towards net-zero emission targets and/or carbon tax policies. Countries with policies already in place include the United States, China, Canada, the UK, the Eurozone, Argentina, Mexico, Columbia, Chile, South Africa, and Kazakhstan.
Given the incredible collaboration between the private and public sectors to drive these new industry standards and policies, there are three subsequent questions a skeptical investor might ask:
- Are carbon markets capable of solving the issue of greenhouse gas emissions?
- What is the forecast / outlook for carbon markets?
- How can retail investors allocate capital to carbon markets?
The Acid Rain Case Study
Let’s tackle the first question – Are carbon markets capable of solving the issue of greenhouse gas emissions? – using the famous acid rain case study(3).
The acid rain program began in 1995 in the United States and was developed for the purpose of removing Sulfur Dioxide (SO2) and Nitrogen Oxides (NOX) from the atmosphere. SO2 and NOX are the two primary pollutants that drive acid rain. The initiative called for a ten million-ton reduction in SO2 emissions, and a one million-ton reduction in NOX emissions by the year 2020, using the 1980 emission levels as a starting baseline.
Similar to the carbon emission markets of the present day, the SO2 and NOX markets leveraged a strategy that combined government policy with drastic changes to private sector operations. More specifically, there were two major components to this strategy, which resulted in the SO2 and NOX markets coming to fruition. The first component of this strategy was the emission reduction targets previously mentioned. These emission reduction targets were set by the United States government in collaboration with the Environmental Protection Agency (EPA). The second component of the strategy was the creation of the SO2 and NOX Cap and Trade Program. The Cap and Trade program laid the groundwork for establishing a market exchange that facilitated free-market pricing of SO2 and NOX(4).
The SO2 and NOX Cap and Trade program has been wildly successful. In short, the program resulted in a 93% reduction in SO2, and an 87% reduction in NOX as of the year 2020, all but wiping out the acid rain issue throughout the entire United States. If the SO2 and NOX cap and trade program can be replicated for carbon, it would appear that markets do have the ability to resolve the carbon emission problem domestically, if not globally.
Compliance Carbon Markets: The Carbon Cap and Trade Program
The carbon cap and trade market for trading carbon allowance credits (futures) is effectively identical to the SO2 and NOX cap and trade markets which successfully combated the acid rain issues across the United States. A visual of how this market functions for Carbon can be viewed in Figure 1 (Carbon Streaming Corporation, Compliance credits).
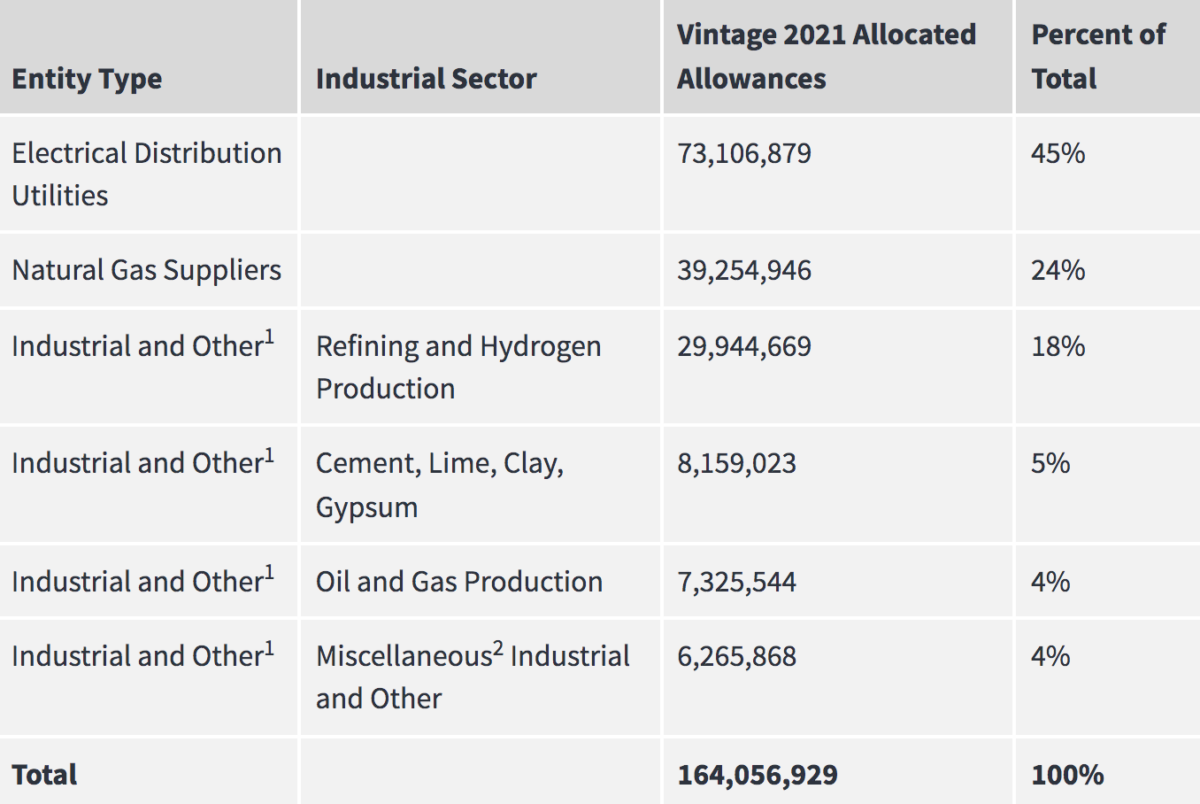
Local, state, or federal policy will dictate maximum emission limits (otherwise known as emission caps). For example, the California carbon allowance allocation for the year 2021 was just over 164 million metric tons (California Air Resources Board). A full breakdown of the various allocations that make up the 164 million metric tons can be viewed in Figure 2. From there, carbon emitters have the ability to buy or sell carbon allowance credits (futures) based on how many metric tons of carbon their operation emits into the atmosphere. Operations that emit more than the cap amount would look to buy carbon allowance credits from an organization that emits less than the cap amount (cough, cough Tesla). Operations that emit less than the cap amount would look to sell their carbon allowance credits to an organization that is emitting more than the cap limit. This market system incentivizes carbon-emitting operations to reduce their carbon footprint. If they are unable to reduce their carbon footprint, they’ll be forced to pay for carbon allowance credits from organizations whose carbon emissions are below the government-mandated cap. Additionally, there are various penalties (in the form of fines) that would be enforced if an organization does not meet the net cap limit, either organically through decreasing their carbon footprint via operations, or inorganically through purchasing carbon allowance credits.
Figure 1: Carbon Cap and Trade Diagram (Carbon Streaming Corporation, Compliance credits)
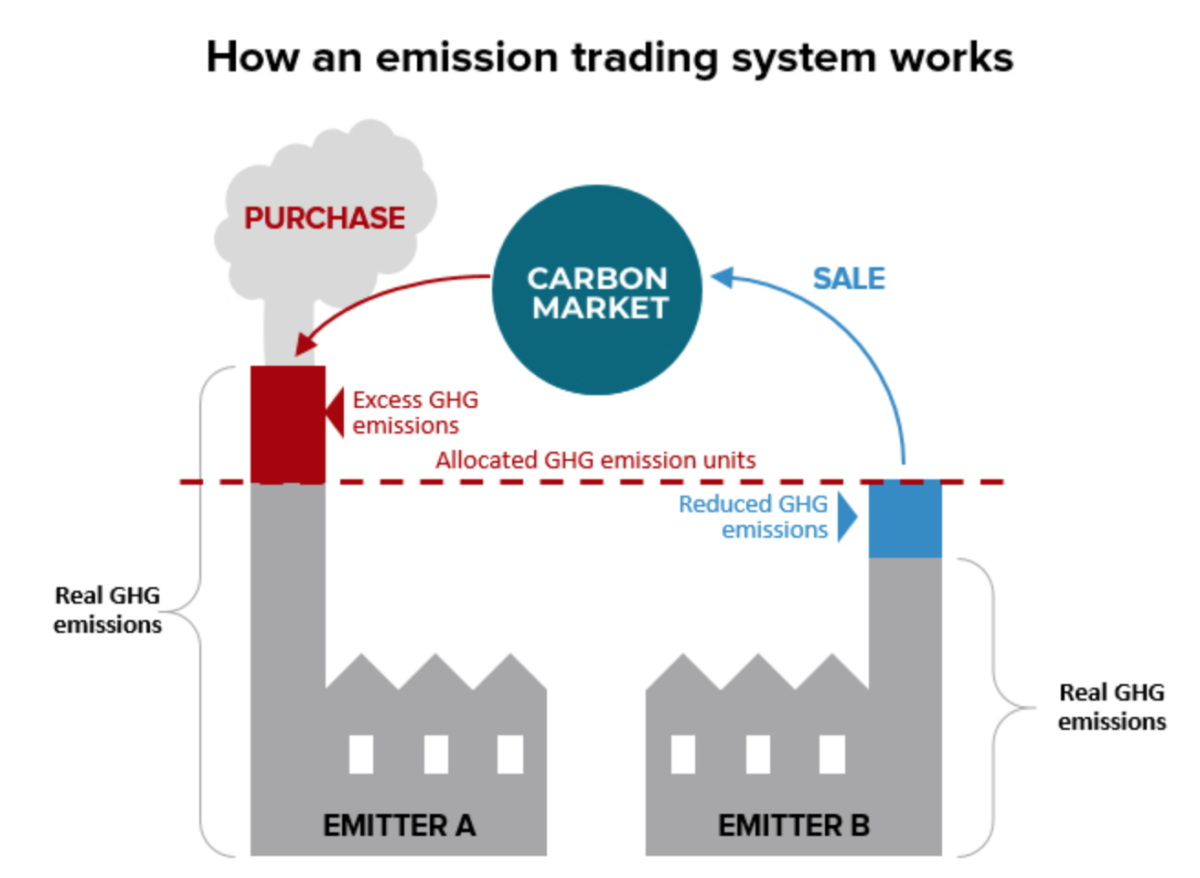
Figure 2: California Carbon Allowance Allocation (measured in metric tons) (California Air Resources Board)
Voluntary Carbon Markets
The second portion of the modern-day carbon market is known as the Voluntary Carbon Market (or voluntary carbon offset credits). Voluntary carbon offsets are a new innovation to Carbon markets that were not part of the acid rain SO2 and NOX cap and trade program.
Voluntary carbon offsets can be generated by voluntarily financing /executing projects that reduce greenhouse gas emissions beyond an operation’s business as usual setup/jurisdiction. Carbon offset credits generated by such projects can be broken out into two categories (Carbon Streaming Corp, Voluntary credits).
The first project category is avoidance/reduction, such as forest conservation or greenhouse gas emission capture. The second project category is removal/sequestration, such as reforestation, wetland restoration, or direct air capture technology(5).
Carbon offset credits can be purchased by governments, public/private entities, or individual investors via some market or exchange. However, once a carbon offset credit is used to reduce the net greenhouse gas emissions of the operation to which it is being applied, those credits can no longer be traded (bought or sold) or applied again elsewhere to a different entity/operation. This holds true for both compliance carbon credits and voluntary carbon credits. There are registries run by independent organizations that (i) verify voluntary carbon offset credits generated through “green” projects, and (ii) track the application of these carbon offset credits against an operation’s greenhouse gas emission levels such that offset credits cannot be re-used. The first organization of its kind to carry out this mission is the American Carbon Registry(6). Another highly reputable organization that carries out the same function is Verra(7).
Investing Opportunities and Market Outlook
Finally, let’s tackle the second and third questions posed earlier in the paper – What is the forecast/outlook for carbon markets, and how can retail investors allocate capital to carbon markets?
The following four charts from Katusa Research(8) do a magnificent job of sizing up the Carbon market, as well as the market forecast/opportunity in the coming decades.
The first chart (Figure 3) shows the total number of companies pledging to go “carbon neutral” or “net zero emissions” as of mid-2021. The chart also shows the companies (reported) scope 1 emissions, measured in billions of metric tons. This data was aggregated from Bloomberg Company Filings. Scope 1 emissions are any greenhouse gas emissions produced directly from a company’s operations(9)(10). The year-over-year trend of companies pledging to go “carbon neutral” is increasing rapidly.
The second chart (Figure 4) shows the value of green bond issuance, year-over-year, measured in billions of USD. This chart indicates two very important trends. First, the bond market is demonstrating its belief in the growth of the green economy. Second, by combining the trend of companies pledging to go “carbon neutral” with the trend of green-bond-issuance, one can deduce that markets agree that the weighted average cost of capital (WACC), or cost to borrow, will continue to be tied to a company’s carbon emissions for years to come(11). In other words, companies who are able to decrease their carbon footprints will be rewarded with lower borrowing costs, directly increasing margins and EBITDA.
The third chart (Figure 5) shows approved green stimulus packages by governments as of March 15th, 2021(12). Given the success of the SO2 and NOX cap and trade program and the re-application of this strategy to carbon markets, it is likely that these values, as well as the number of participating governments, will continue to grow.
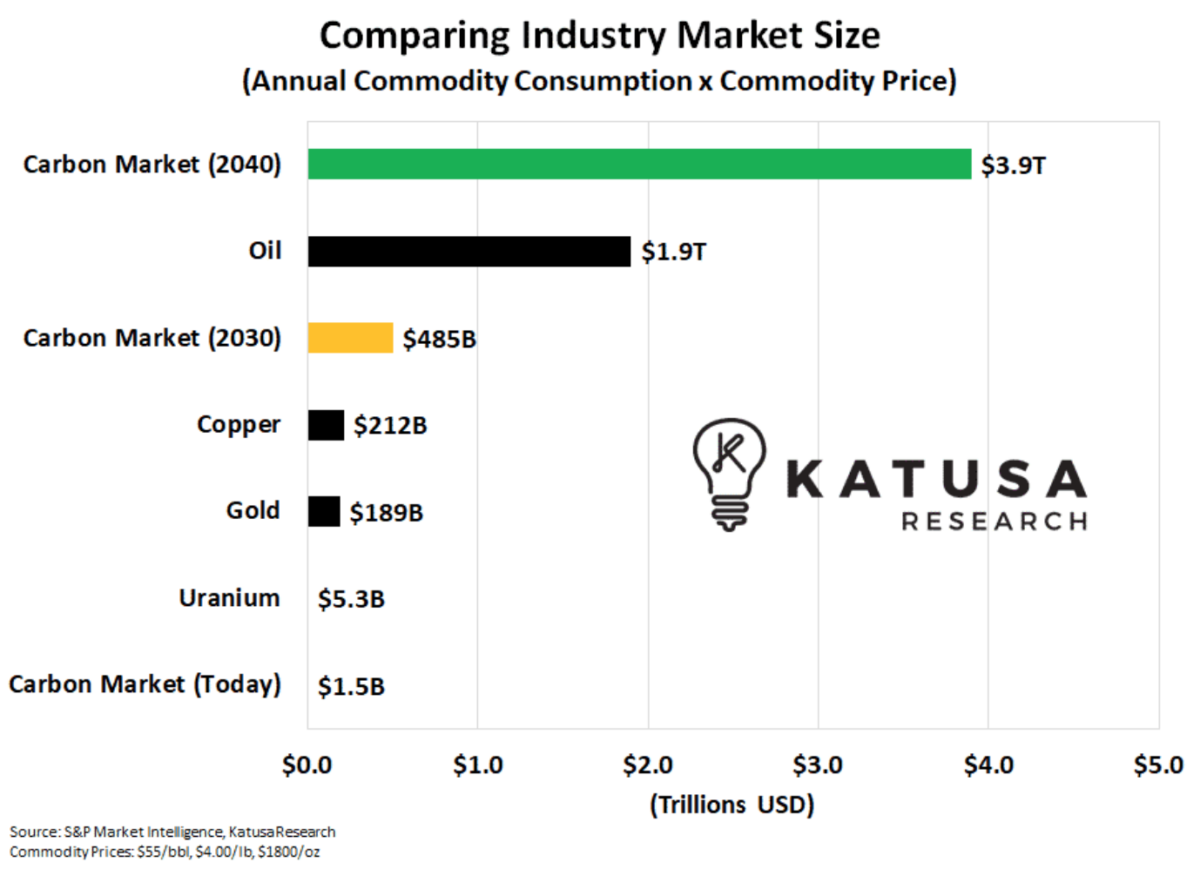
The fourth chart (Figure 6) shows a forecast for the size of the carbon market, compared to other substantial commodity markets. This chart also illustrates the growth of the carbon market from the present day, to the year 2030, and ending in the year 2040(13). The potential growth of this market is startling, especially when compared to the oil market, which has been the predominant energy/commodity market globally for 100+ years.
Figure 3: (Katusa, Katusa Research 2021)
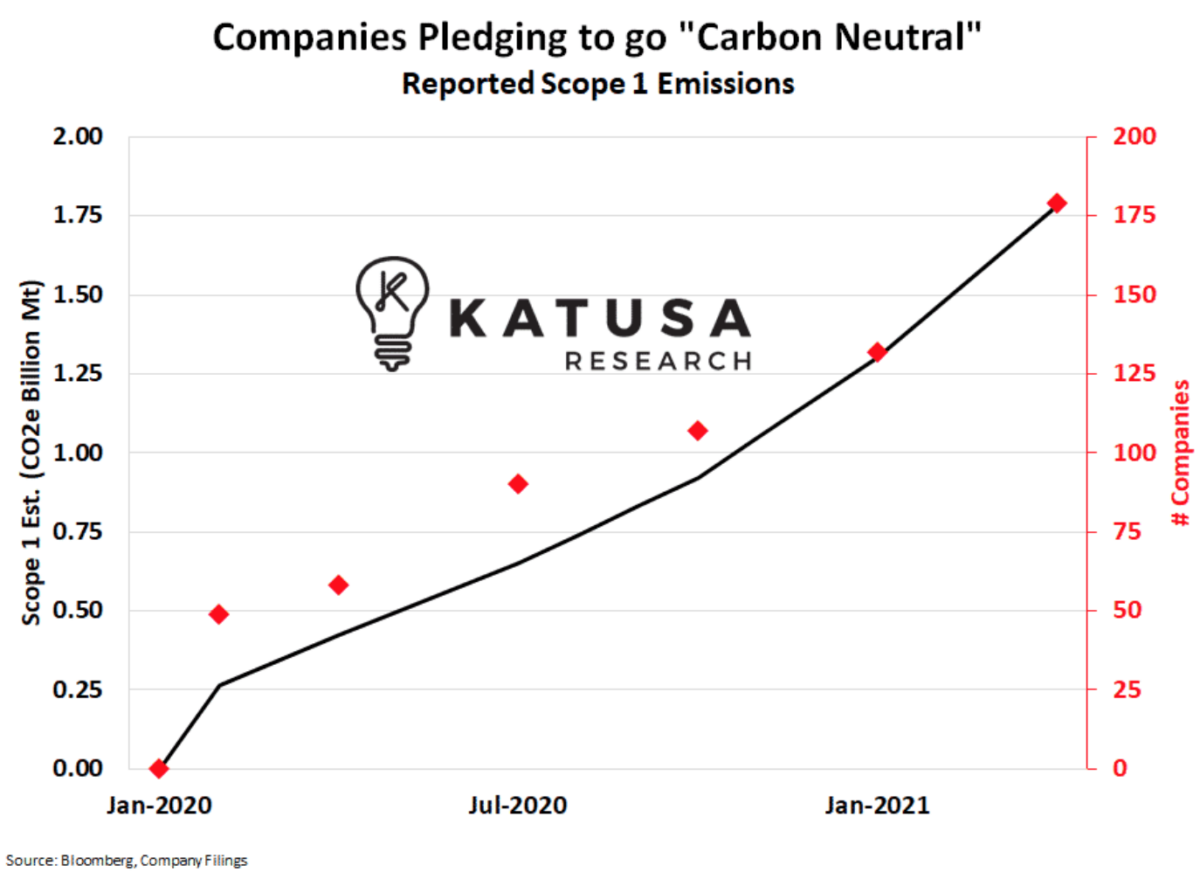
Figure 4 (Katusa, Katusa Research 2021)
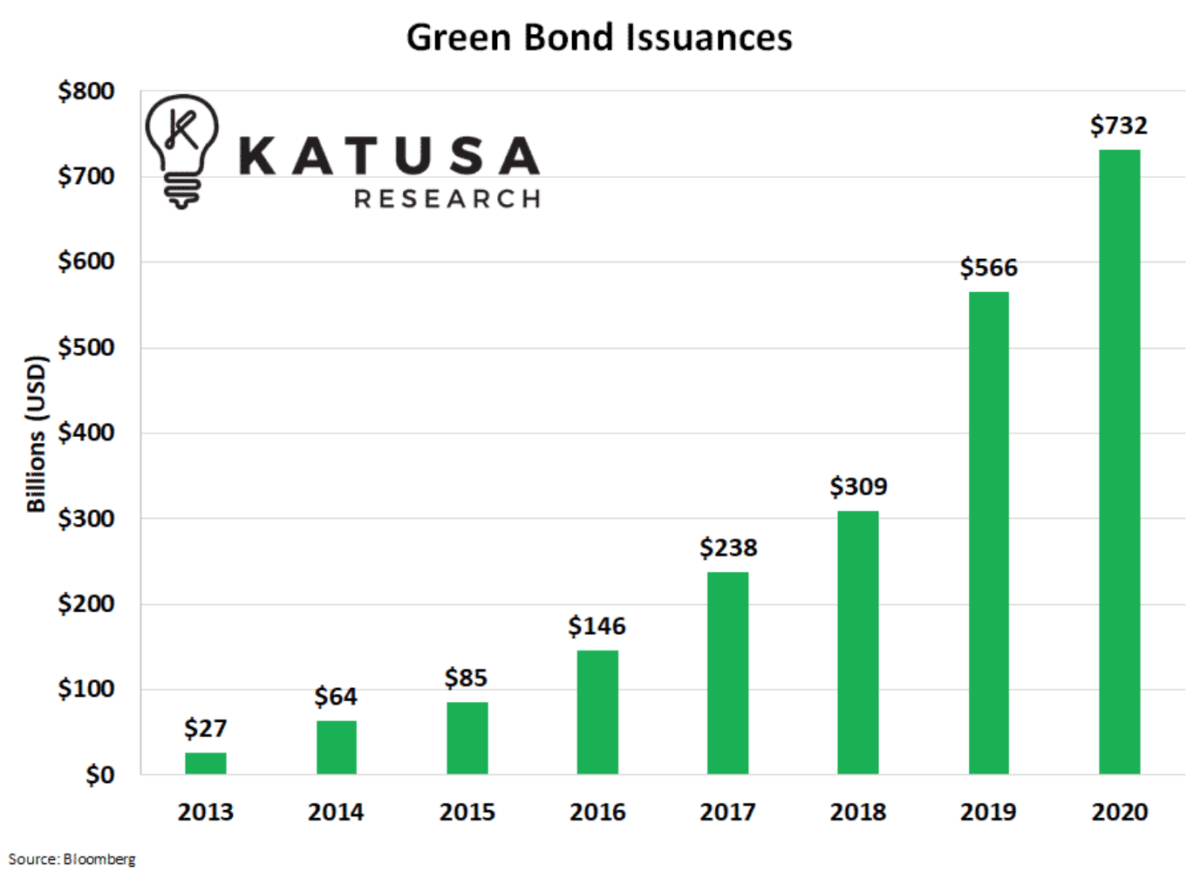
Figure 5 (Katusa, Katusa Research 2021)
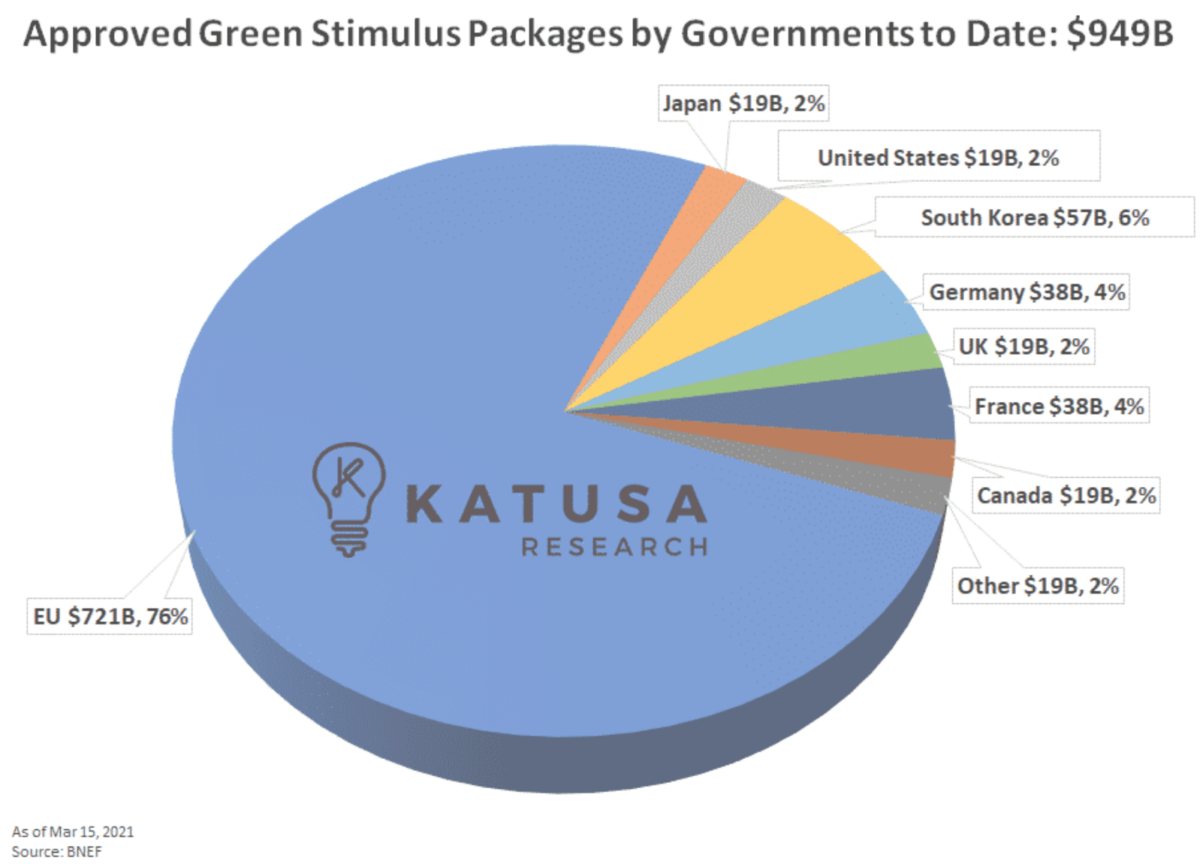
Figure 6 (Katusa, Katusa Research 2021)
Investor Opportunities
Finally, let’s discuss just a couple of the easily accessible investment opportunities for retail investors.
The Kraneshares Global Carbon ETF is the most accessible investment vehicle for investing in carbon markets. This ETF trades on the New York Stock Exchange (NYSE) under the ticker KRBN. This ETF is made up of a variety of carbon allowance futures from various regions and vintages, as well as cash(14).
Another avenue for investing in the future of net-zero is through a company called Carbon Streaming Corporation. Carbon Streaming Corporation is one of the world’s first publicly traded companies that finance projects which generate carbon credits in the voluntary carbon market. They are listed on the Neo Stock Exchange in Canada (Ticker: NETZ). They also trade via Over the Counter (OTC) markets (Ticker: OFSTF). The company plans to list on a major US stock exchange during the year 2022(15). The company’s mission is as follows:
“……Carbon Streaming is focused on acquiring, managing and growing a high quality and diversified portfolio of investments in projects and/or companies that generate or are actively involved, directly or indirectly, with voluntary and/or compliance carbon credits. By offering innovative financing solutions, the Company aims to accelerate the world’s transition to a net-zero carbon future by bringing capital to projects that might not otherwise be developed. Many of these projects may also have significant social and economic co-benefits in addition to reducing emissions as the Company aspires to make a sustainable impact beyond climate action with certain investments.”
Carbon Streaming Corp, Company profile
Like any up-and-coming asset class/investment opportunity, there are significant risks and challenges that must be overcome in order for carbon markets to effectively combat greenhouse gas emissions globally. However, if we as a society are going to have any chance at solving this problem, it’s time to stop talking about the change, and instead, start being about the change. The opportunity for investing capital to drive innovation in this industry is readily available. Like any risky investment, those who are willing to take the risk deserve the reward in the form of profits and shareholder returns. Do your own research, learn about the risks before allocating capital, and don’t ever doubt the power of free markets and capitalism to optimize the resources we have at our disposal. If the juice is worth the squeeze, free-market capitalism always finds a way.
References[+]
| ↑1 | Ferringer, Best performing ETFs of the Year – etf.com |
|---|---|
| ↑2 | Geck, Seven major companies that committed to net-zero emissions in 2021), (Murray, Which major oil companies have set net-zero emissions targets? 2020), (Our net zero climate pledge 2021), (Huebach, Auto industry’s push for net-zero emissions 2021) |
| ↑3 | EPA, Acid Rain Program |
| ↑4 | a detailed explanation of how Cap and Trade markets function can be found in the following sections |
| ↑5 | Carbon Streaming Corp, Voluntary credits |
| ↑6 | American Carbon Registry, Our mission |
| ↑7 | Verra 2022 |
| ↑8 | Katusa, Katusa Research 2021 |
| ↑9 | Makeev, What are Scopes 1, 2 and 3 of carbon emissions? 2021 |
| ↑10 | The detailed definitions for scope 1, scope 2, and scope 3 emissions can be found here |
| ↑11 | Katusa, Katusa Research 2021 |
| ↑12 | Katusa, Katusa Research 2021 |
| ↑13 | Katusa, Katusa Research 2021 |
| ↑14 | The specific holdings for the KRBN ETF can be viewed here: (Kraneshares Global Carbon Strategy ETF: KRBN |
| ↑15 | Carbon Streaming Corp, Company profile |
About the Author: Adam Solomon
—
Important Disclosures
For informational and educational purposes only and should not be construed as specific investment, accounting, legal, or tax advice. Certain information is deemed to be reliable, but its accuracy and completeness cannot be guaranteed. Third party information may become outdated or otherwise superseded without notice. Neither the Securities and Exchange Commission (SEC) nor any other federal or state agency has approved, determined the accuracy, or confirmed the adequacy of this article.
The views and opinions expressed herein are those of the author and do not necessarily reflect the views of Alpha Architect, its affiliates or its employees. Our full disclosures are available here. Definitions of common statistics used in our analysis are available here (towards the bottom).
Join thousands of other readers and subscribe to our blog.