Supply Constraints and Limits to Arbitrage in the ETF Loan Market
- Sanjeev Bhojraj and Wuyang Zhao
- working paper
- A version of this paper can be found here
- Want to read our summaries of academic finance papers? Check out our Academic Research Insight category
What are the Research Questions?
The growth of ETFs has been explosive (and we aren’t helping the matter via ETF Architect which facilitates low-cost high quality ETF white label services). At the end of 2020, there was roughly $5.4 trillion invested in ETFs in the United States, representing more than 25% of US market trading by daily volume in the recent decade (ICI Factbook, 2021). One of the many benefits of ETFs relative to mutual funds is investors’ ability to borrow and short these instruments. However, the ETF loan market is different and less understood than the stock loan market. The first key difference is that Investment Companies (ICs)’ ownership in ETFs is severely limited by regulations(1). The second difference is that, unlike stocks, new ETF shares can be created when needed to meet borrowing demand through primary market transactions — through the create-to-lend (CTL) mechanism. As a consequence of this, a frictionless operation of the CTL mechanism would eliminate any shortage in ETF shares available to borrow and remove the supply-side constraints in the ETF loan market caused by the ownership structure. Hence, in the ETF loan market, the greater supply flexibility changes the relation between price and quantities, with price being potentially more inelastic to demand changes. The authors of this paper ask:
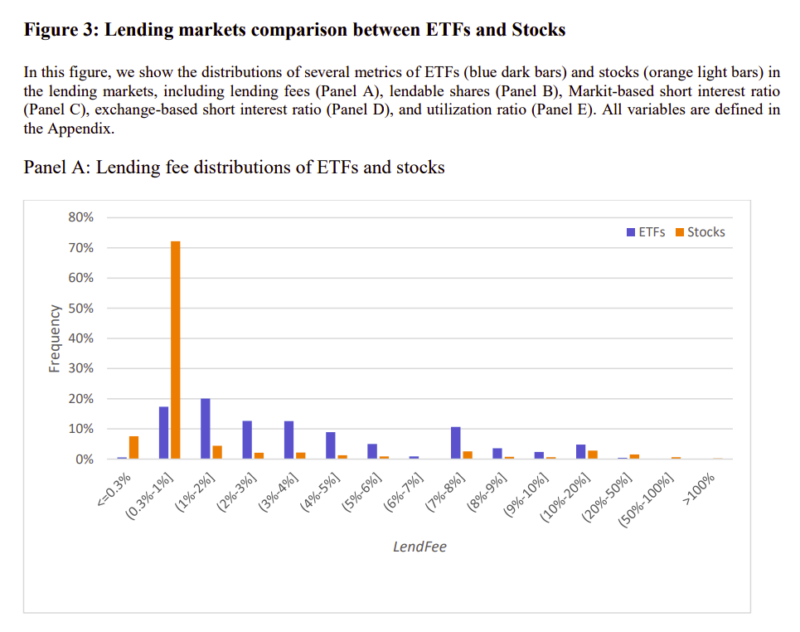
- Are ETF lending fees different from stocks lending fees?
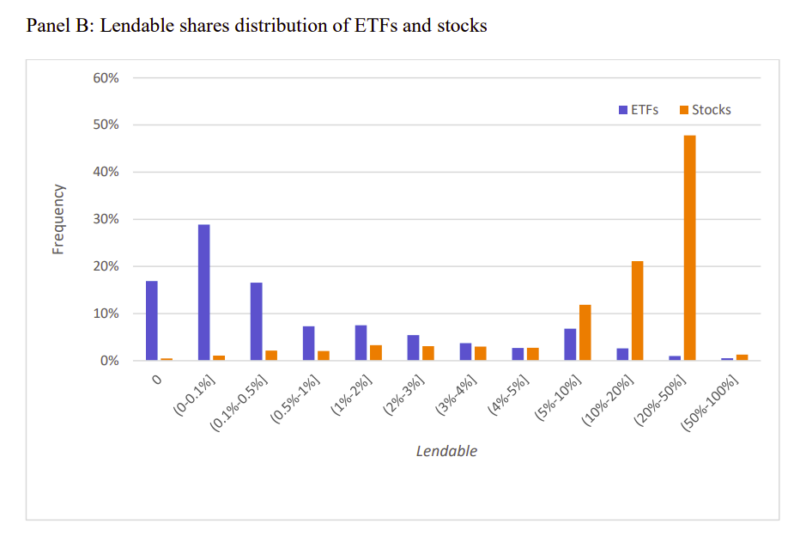
- Are ETF lendable shares fewer than stocks’ lendable shares?
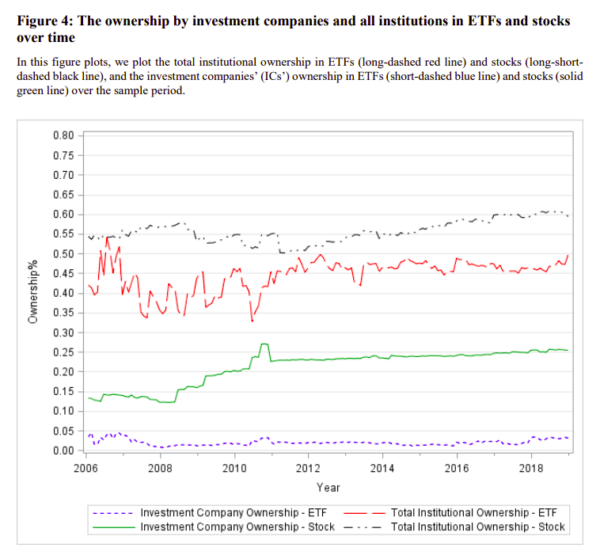
- Is there a constraint on ICs’ ability to own ETFs?
- What role does short interest play?
- What explains the lending fee gap?
What are the Academic Insights?
The authors found that:
- YES- ETF lending fees are significantly higher. The median lending fee for ETFs is 300 basis points, which is eight times the median lending fee for stocks at 37.5 bps. Further, while nearly 80% of stocks have lending fees below 100 bps, only less than 18% of ETFs satisfy the same criteria.
- YES- The average lendable shares for ETFs is 2.2% of shares outstanding compared to an average of 19.6% for stocks.
- YES, ICs own on average about 22% of equity shares in our sample but only about 2% of ETF shares. This insignificant IC ownership and the resulting lack of competition in the ETF loan market leads to a low level of lendable shares and high lending fees.
- An increase in short interest leads to an increase in lending fees for both ETFs and stocks. However, while increases in stock lending fees become more sensitive to increases in short interest when the supply is constrained, increases in ETF lending fees do not display greater sensitivity to the demand increases under similar conditions.
- The composite borrowing cost of the ETF constituents, together with the management fee paid to the ETF provider (henceforth composite lending fee) accounts for on average 38.5% (median = 26.1%) of the overall ETF lending fees. Other explanatory mechanisms are the average size of the borrowing transaction, the lenders’ risks when they cannot effectively borrow all of the ETF constituents, low lendable shares, and high utilization.
Why does it matter?
This paper enhances the understanding of the ETF loan market by identifying two institutional features unique to ETFs that affect the supply of shares in the loan market and lending fees. Additionally, it also adds to the growing stream of work examining the roles of ETFs in financial markets by providing insights on the constraints in using ETFs as a short-selling device.
The Most Important Chart from the Paper:
Abstract
We find that exchange-traded fund (ETF) lending fees are significantly higher than stock lending fees. Two institutional features unique to ETFs play significant roles in explaining the high fees. First, regulations restrict investment companies, such as mutual funds and ETFs, from owning ETFs. As these institutions are key lenders, their absence reduces the lendable supply in the ETF loan market. Second, while the create-to-lend (CTL) mechanism alleviates supply constraints when borrowing demand increases, its efficacy is limited by the associated costs and frictions. Our results speak to the limits to arbitrage in the ETF markets.
About the Author: Elisabetta Basilico, PhD, CFA
—
Important Disclosures
For informational and educational purposes only and should not be construed as specific investment, accounting, legal, or tax advice. Certain information is deemed to be reliable, but its accuracy and completeness cannot be guaranteed. Third party information may become outdated or otherwise superseded without notice. Neither the Securities and Exchange Commission (SEC) nor any other federal or state agency has approved, determined the accuracy, or confirmed the adequacy of this article.
The views and opinions expressed herein are those of the author and do not necessarily reflect the views of Alpha Architect, its affiliates or its employees. Our full disclosures are available here. Definitions of common statistics used in our analysis are available here (towards the bottom).
Join thousands of other readers and subscribe to our blog.