By the middle of 2019, we had been running an ensemble of relative sentiment(1) indicators in live asset management for several years. One of the components of that ensemble was a strategy that looked at Sentix sentiment indices. For those unfamiliar with Sentix (a German company), every week it polls institutions and individuals separately about their current and future outlooks on various markets and economies worldwide.
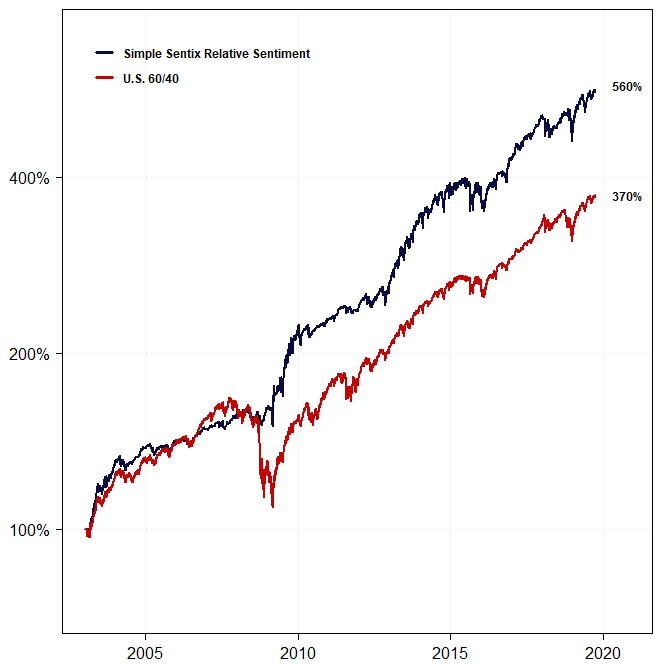
At the time, our Sentix-based relative sentiment strategy was embarrassingly simple. We took the difference between monthly institutional economic sentiment and individual economic sentiment in each of four different regions–U.S., Europe, Japan, and Asia ex-Japan–which left us with four relative sentiment indices.
A positive index value meant institutions were more bullish than retail traders on a given region’s economy 6-months forward. At each point in time, we took the number of positive indices and multiplied by 25% to arrive at the strategy’s desired equity allocation.
For example, if three of the four regions had positive relative sentiment, our desired equity allocation would be 75%. As one can see, the strategy’s equity allocation was discrete–it could take only the values 0%, 25%, 50%, 75%, or 100%, depending on the number of regions with a positive relative sentiment. The share of the portfolio not invested in equities was invested in an aggregate bond index.
Here’s a backtest of that simple strategy up to September 2019 compared to a U.S. 60/40:
Despite the strategy’s relatively solid performance, we wondered whether we might be able to improve its performance by using machine learning. We had recently written a paper about relative sentiment using data from the Commitments of Traders Report, which demonstrated that institutions, as measured by relative sentiment, had the remarkable ability to time both the equity market and Smart Beta factors (over intermediate time horizons) with extreme degrees of statistical significance.
Our simple Sentix relative sentiment strategy appeared to corroborate our belief that relative sentiment was an anomaly. But given its simplicity, we thought perhaps there was a way to extract even more information from the data.
We thus decided to embark on a project where we would apply various machine learning algorithms to the Sentix data. We had not had much success using machine learning in the past, so we were appropriately skeptical that anything more useful than the naïve strategy would result from this project.
Much to our surprise, however, the results were quite encouraging and appeared to further bolster the notion that relative sentiment as a factor has nontrivial predictive power. We published the results in the SSRN paper Relative Sentiment and Machine Learning for Tactical Asset Allocation. Here we will summarize the results of this study.
Data and Methodology
The technical setup involved in this project was fairly intricate. If one is interested in the details, we encourage one to check out the description in the paper. Here we will try to keep the exposition relatively high-level.
Data
As discussed above, for the monthly relative sentiment data we used the difference between Sentix’s institutional and individual 6-month forward economic sentiment indices in the U.S., Europe, Japan, and Asia ex-Japan.
We obtained our monthly equity returns for those respective regions from Professor Ken French’s data library(2).
Methodology
We applied a variety of machine learning (ML) algorithms to Sentix’s relative sentiment data. The ML algorithms came from various R packages.
Each quadruplet consisting of the following four elements constituted a strategy:
- A particular machine learning algorithm (e.g., random forest regression, support vector classification),
- A particular set of parameters for that algorithm,
- A particular set of input relative sentiment indices (we looked at all combinations of two or more regions), and
- A given region’s time series of monthly equity returns
The output of each strategy was a time series of forecasted equity allocations for the region under consideration.
We used combinatorial cross-validation (CCV)(3) to structure the training and testing of the strategies. CCV is rather involved, so we refer readers to the paper for specifics. We looked at two different applications of CCV, one referred to as CCV{15,2} in what follows and the other referred to as CCV{24,2}.
For each region, there were 990 different “strategies” (resulting from the totality of combinations of different ML algorithms, different ML parametrizations, and different input combinations of relative sentiment indices).
Once a strategy generated a set of forecasted equity allocations, we took those allocations and turned them into two different tactical strategies–one that invested the non-equity share of the portfolio in bonds (i.e., an aggregate bond index)–similar to what one might do in practice–and the other that invested the non-equity share of the portfolio in cash–in order to isolate the equity forecasting ability of the strategies.
Thus, for each region, we ended up with a set of 990 tactical strategies that invested in equities and bonds and a set of 990 that invested in equities and cash. Because we ran the analysis using two different sets of CCV parameters, we ultimately ended up with the following four sets of outputs:
- 990 strategies: Equities + Bonds, CCV{15,2}
- 990 strategies: Equities + Cash, CCV{15,2}
- 990 strategies: Equities + Bonds, CCV{24,2}
- 990 strategies: Equities + Cash, CCV{24,2}
We then repeated the foregoing process for the standalone component sentiment. That is, instead of using relative sentiment as the input to the strategies, we used the institutional and individual sentiment indices themselves.
For example, if the input features of a relative sentiment strategy were the relative sentiment in Europe and the relative sentiment in Japan (i.e., two input features), the corresponding component sentiment strategy would use the institutional and individual sentiments in both Europe and Japan (i.e., four input features). The goal was to see whether the standalone component indices provided more predictive information than the relative sentiment indices.
Finally, because there were so many different output strategies in each region, it would be natural to find some that looked good simply by random chance. One way to assess whether a particular strategy from among a multitude of strategies is actually statistically significant is to use what is called a “multiple hypothesis testing” (MHT) algorithm(4). Thus, we employed an MHT algorithm to identify which strategies were legitimately significant at various levels of statistical significance.
Statistical Significance of Strategies
For the MHT algorithm, we looked at six different levels of statistical significance (note: these levels do not correspond to the well-known p-value from hypothesis testing), namely, 0.01, 0.02, 0.05, 0.10, 0.15, and 0.30. López de Prado and Lewis (2018)(5) show that any level less than 0.30 is conservative and will likely result in turning away legitimately significant strategies. Thus, one may consider our levels (which go as low as 0.01) as being overly conservative.
Part (a) of the table below shows the number of U.S. relative sentiment strategies that were significant at each of those aforementioned levels. Part (b) shows the number of U.S. component sentiment strategies that were similarly significant.
Looking at the first row in part (a), we see that for strategies consisting of equities and bonds, with CCV parameters of {15,2}, 359 of the 990 U.S. relative sentiment strategies were significant at the 0.30 level. At the 0.01 level, 34 were still significant.
In contrast, only 29 of the component sentiment strategies in the U.S. were significant at the 0.30 level and no component sentiment strategies were significant at the 0.01 level. Clearly, relative sentiment was providing more predictive information than component sentiment.
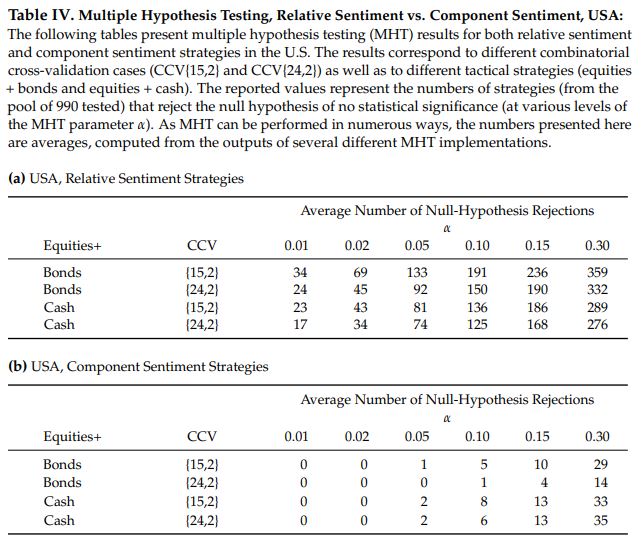
For non-U.S. regions, while the overall number of significant relative sentiment strategies was much less than in the U.S., the same phenomenon was observed. That is, there tended to be more relative sentiment strategies than component sentiment strategies of significance at each significance level and particularly at the most stringent significance levels (where component sentiment strategies rarely registered).
Economic Significance of Strategies
Besides looking at the statistical significance of the relative sentiment strategies, we also looked at their economic significance by comparing their performance to a set of benchmarks.
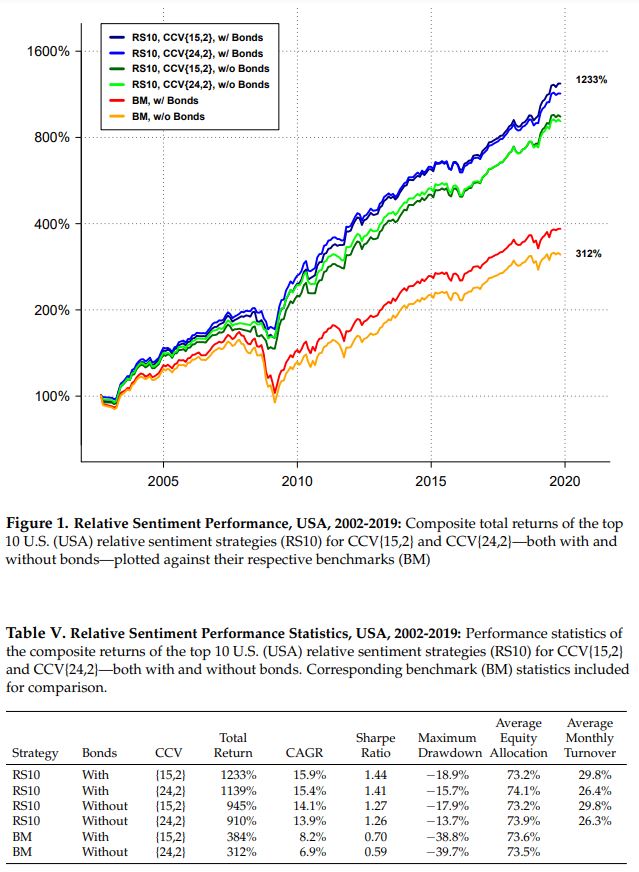
We took the average performance of the top 10 relative sentiment strategies in each region and compared it to the performance of both an equity/bond benchmark and an equity/cash benchmark (in the region under consideration). For an apples-to-apples comparison, the benchmarks’ equity allocations in each region were rebalanced each month to equal the time-weighted average equity allocation of the composite relative sentiment strategy for the region. (For example, over time the average equity allocation of the U.S. composite relative sentiment strategy was roughly 73%. Thus, the U.S. benchmarks’ equity allocations were set to 73% for comparison purposes.) We performed this analysis for both the equity/bond and equity/cash strategies as well as both CCV parametrizations.
The chart and table below show the results for the U.S. Relative sentiment clearly outperformed the static benchmarks, both in absolute and risk-adjusted terms. We observed similar relative performance for the non-U.S. regions.
It is interesting to note that regardless of which composite we look at, the machine-learning-based composite relative sentiment in the U.S. essentially doubled the return of the “simple Sentix relative sentiment strategy” shown at the beginning of this article. It thus appears that an ensemble-based machine-learning approach was able to extract additional information from the Sentix data.
Relative Sentiment Trumps Momentum
One of the more interesting results to come out of our first relative sentiment paper was that equities tend to have their best returns when momentum is negative but relative sentiment is positive. We wanted to see if that observation held with Sentix-based relative sentiment as well.
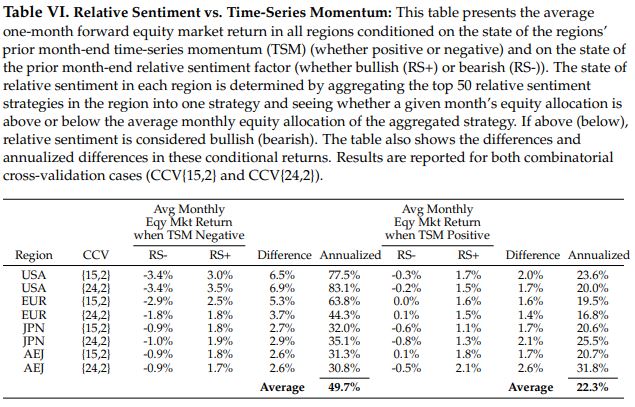
To measure this, we looked at the monthly return of each region’s equity index conditioned on the states of the region’s relative sentiment and time-series momentum (TSM) at the end of the prior month. The table below shows the results for all regions.
Looking at the U.S., we found that when TSM was negative and relative sentiment was also negative, the average 1-month forward U.S. equity return was -3.4%. Which is to say, don’t buy the dip when institutions are bearish!
In contrast, when TSM was negative but relative sentiment was positive, the average 1-month forward U.S. equity returns was +3.0%. That is, it pays to buy the dip when institutions are bullish!
The annualized return difference between those two states is 77.5%. These findings corroborated the results from our initial relative sentiment paper. The results for other regions were directionally similar.
The upshot: Knowing the state of relative sentiment provides more directional information than knowing the state of time-series momentum.
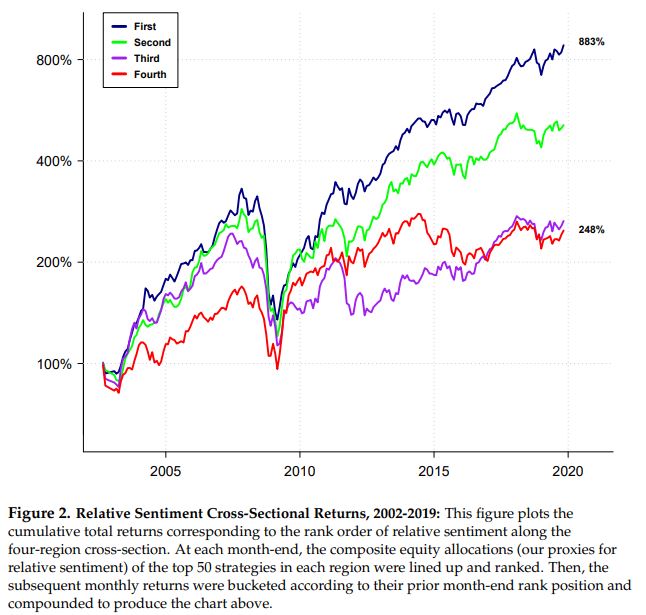
Relative Sentiment Along the Cross-Section
As discussed above, the output of the ML strategies is a forecasted equity allocation. We wanted to see if the rank order of these forecasted allocations across regions was predictive of their subsequent relative returns. That is, did the regions with higher forecasted equity allocations (derived from relative sentiment) outperform the regions with lower forecasted equity allocations? The answer to this question was yes and it confirmed an analysis (made using a completely independent dataset) initially reported in this blog post.
We took the top 50 relative sentiment strategies in each region and averaged their forecasted equity allocations at each point in time to arrive at four composite strategies (one for the U.S., one for Europe, one for Japan, and one for Asia ex-Japan).
We then ranked the composite forecasted allocations of those regions at each point in time. Next, we created four strategies. One strategy held, each month, the region with the highest equity allocation for that month; one held the region with the second-highest allocation; one held the region with the third-highest allocation; and the last held the region with the lowest-ranked allocation for the month.
The chart below shows the results of those four strategies, from which we can see that the strategy that, each month, held the region with the highest forecasted equity allocation delivered the best overall performance. The strategy that, each month, held the region with the lowest forecasted equity allocation delivered the worst overall performance. And the other strategies fell somewhere in between in the correct ranking order.
This suggests that relative sentiment might be useful in identifying the best and worst-performing assets along a cross-section.
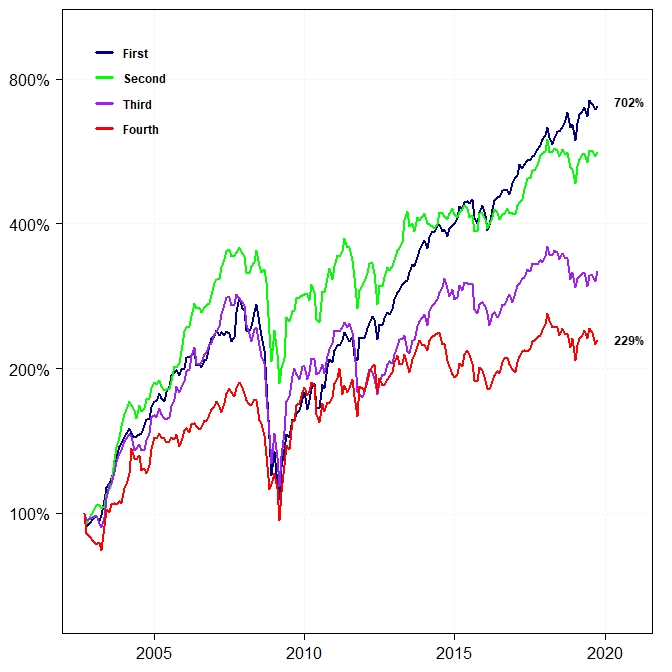
One thing to note–and we overlooked this when writing the paper–is that some regions (e.g., Europe and Asia ex-Japan) do not have 50 relative sentiment strategies that meet the minimum MHT standards of statistical significance. In this case, it might be more appropriate to create composites of the top 10 strategies in each region rather than the top 50.
Below is a reproduction of the preceding cross-sectional performance chart, but using only the top 10 relative sentiment strategies in each region. The overall performance order remains the same (despite the “Second” strategy jumping out to an early lead).
Conclusion
The application of machine learning models to Sentix relative sentiment data appears to extract more predictive information than our original, simplistic approach was capable of.
The results from this study jibe with earlier relative sentiment results generated using an entirely independent dataset. The correspondence in results likely says more about relative sentiment as a factor (institutions tend to outperform individuals) than it does about machine learning as a tool–as machine learning models typically are only as good as their input features.
This study was originally conducted in September 2019, nearly three years ago. You might be wondering how this strategy has performed out of sample and post-publication? Well, in our next installment, we will examine that out-of-sample performance. Stay tuned!
If you are interested in how you might be able to incorporate relative sentiment factors into your portfolios, contact us at [email protected] to learn more.
References[+]
| ↑1 | Relative sentiment is a factor that measures the position, flows, and attitudes of institutional investors to those of individual investors. |
|---|---|
| ↑2 | French, Kenneth R., 2017, Data library, http://mba.tuck.dartmouth.edu/pages/faculty/ ken.french/data_library.html. |
| ↑3 | López de Prado, Marcos, 2018, Advance in Financial Machine Learning (John Wiley & Sons, Inc.). |
| ↑4 | Romano, Joseph P., and Michael Wolf, 2007, Control of generalized error rates in multiple testing, Annals of Statistics 35, 1378–1408. |
| ↑5 | López de Prado, Marcos, and Michael J. Lewis, 2018, What is the optimal significance level for investment strategies?, SSRN Electronic Journal, URL: https://ssrn.com/abstract=3193697. |
About the Author: Raymond Micaletti
—
Important Disclosures
For informational and educational purposes only and should not be construed as specific investment, accounting, legal, or tax advice. Certain information is deemed to be reliable, but its accuracy and completeness cannot be guaranteed. Third party information may become outdated or otherwise superseded without notice. Neither the Securities and Exchange Commission (SEC) nor any other federal or state agency has approved, determined the accuracy, or confirmed the adequacy of this article.
The views and opinions expressed herein are those of the author and do not necessarily reflect the views of Alpha Architect, its affiliates or its employees. Our full disclosures are available here. Definitions of common statistics used in our analysis are available here (towards the bottom).
Join thousands of other readers and subscribe to our blog.