The past few years in the stock market have been pretty crazy. And the pinnacle of “crazy” was during March 2020 — peak chaos in the stock market.
Below is a chart of US large-cap stocks and small-cap stocks in 2020. Note the monster crash in March — watch out below!
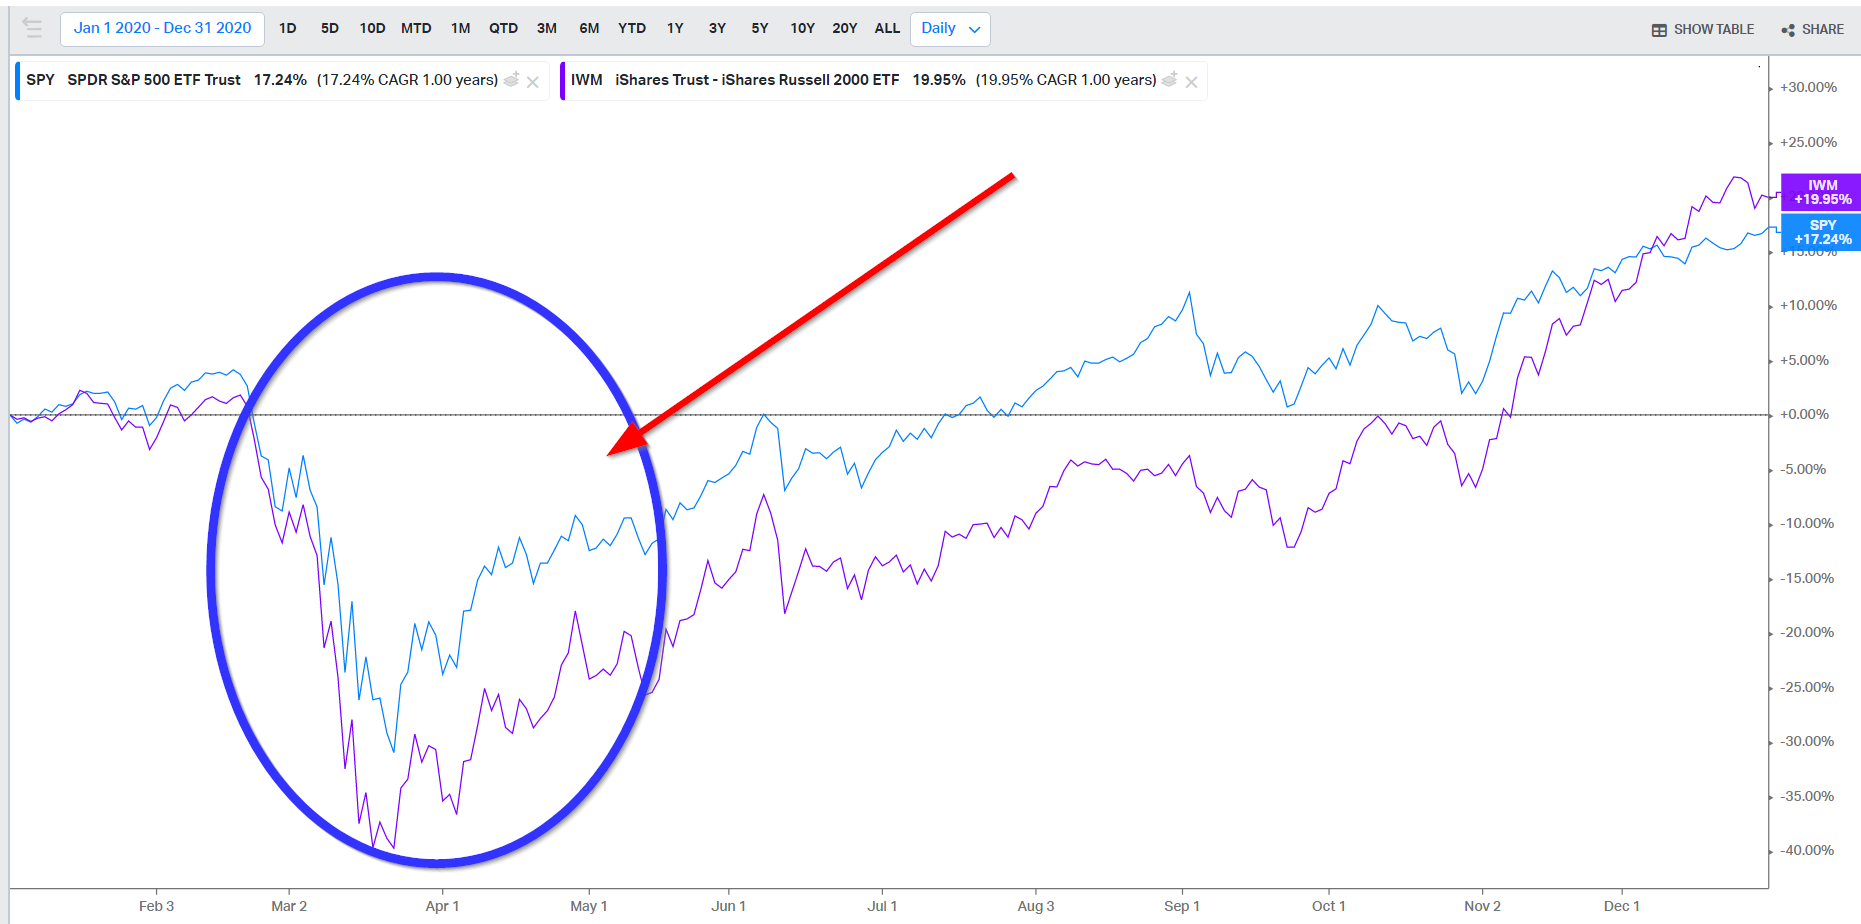
As an individual investor in the late 90’s internet bubble burst, and having launched a hedge fund in September 2008, I thought I had enough chaos for one investor’s lifetime. But March 2020 really took the grand prize…especially if you were a value investor like me (not even going to post the chart because it might trigger me).
A natural question I’ve started asking is, “Has the stock market changed?”
Things seem extremely volatile and faster-paced these days. And for seemingly good reasons — a lot has changed in the marketplace with the introduction of high-frequency trading, the proliferation of DIY retail investing, a strong march towards passive index investing, vastly superior data and technology access, and so forth. These environmental changes are dramatic and profound and must have changed price dynamics?
So market dynamics must have changed, right? Well, I’m not sure, but we can test the hypothesis.(1)
Has the stock market changed?
Below, we compile daily US stock market returns going back as far as possible. We splice several datasets together from Bill Schwert and Ken French and create a time series that spans from February 17, 1885 to July 29, 2022 — nearly 138 years of data!
First a chart of the daily returns and the 200-day moving average of daily returns:
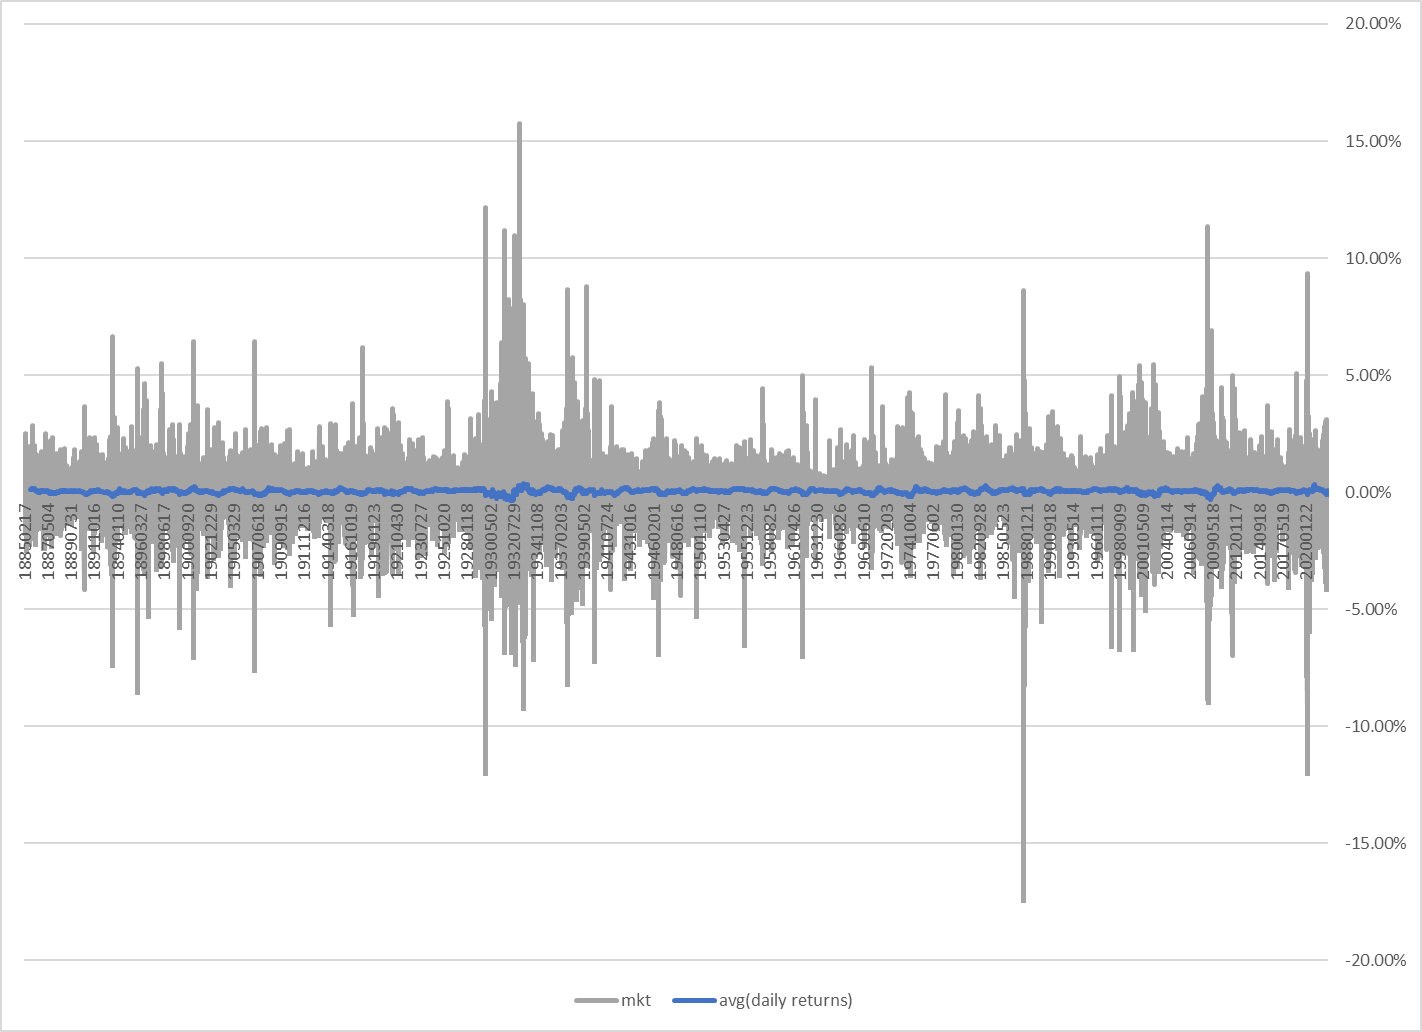
Visually, we can only make the claim that the stock market is generally bat-sh#$ crazy. However, we can’t make the claim that recent market volatility is substantially different than other periods of time in the US market.
Takeaway: the stock market is always volatile and can move quickly in one direction or the other.
Next, we have a histogram of daily returns from the first half of the sample and the second half of the sample. We can use this to assess if the empirical distribution of daily returns is different in the first half of the sample relative to the second half of the sample.
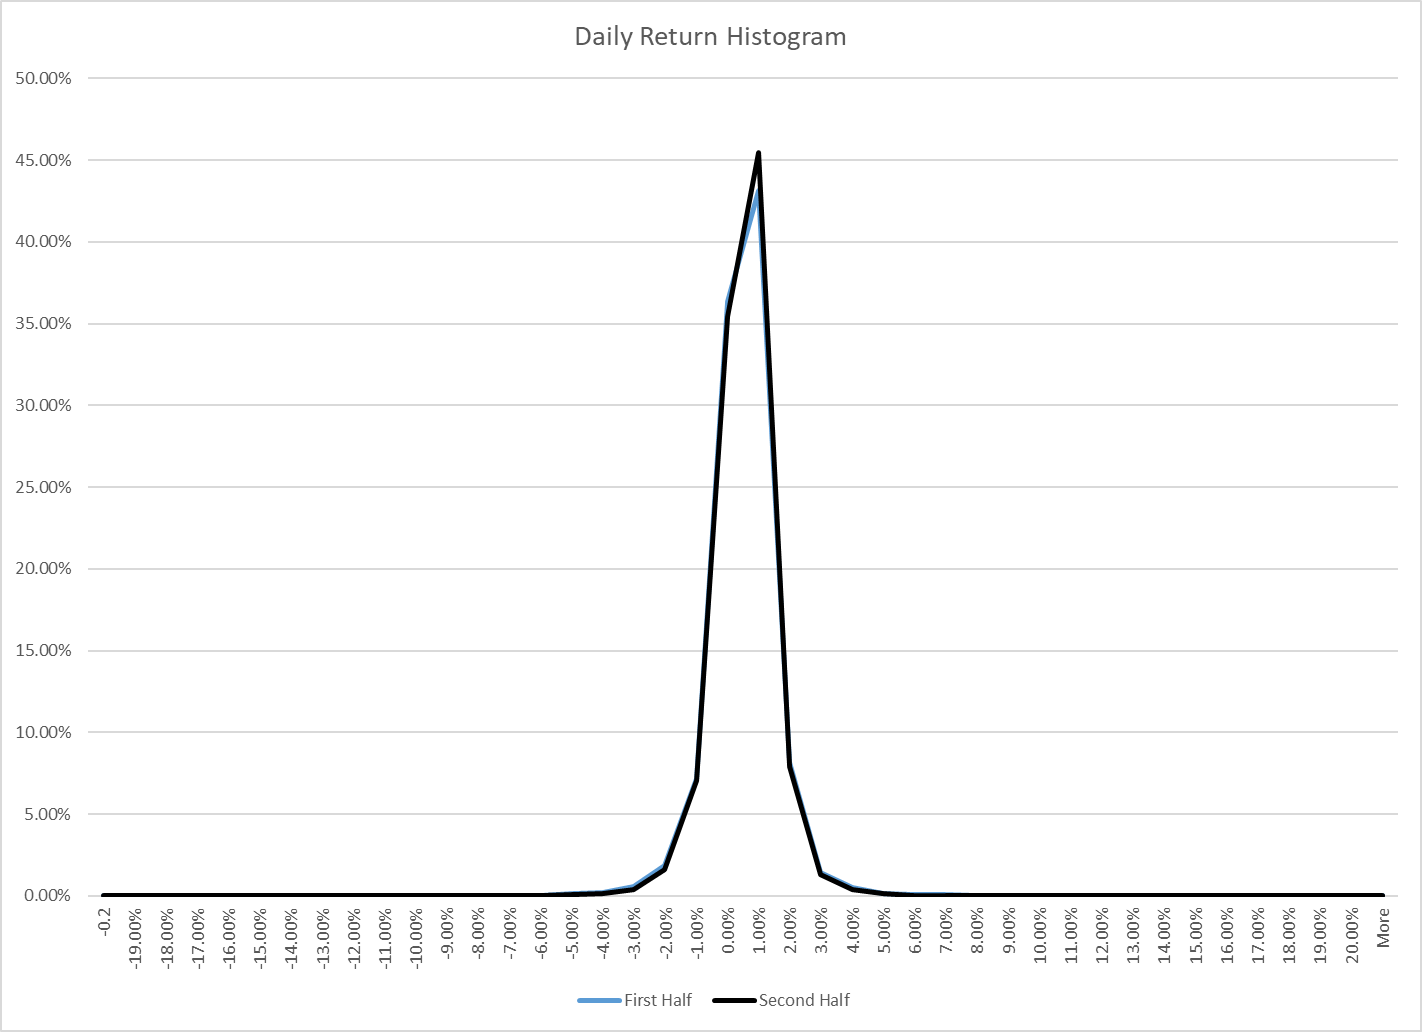
Hrmm. The two histograms essentially overlay on top of one another, and the vast majority of observations sit in the -4% to +4% range.
Takeaway: there does not seem to be any noticeable difference in stock market returns between the ‘modern’ period and the ‘old’ period.
Conclusions
This time is almost always different, it seems, but the data suggest that things are typically always the same: chaotic and volatile. Stock market investors should be prepared for large short-term moves in stocks, and they should be skeptical of narratives suggesting a causal relationship between environmental variables and future volatility.
Perhaps the one thing that stays constant in the stock market game are the humans playing the game. The players involved, regardless of the tools deployed in the game, are driven by strong fear and greed emotions that react relatively unpredictably to uncertain environments.
References[+]
| ↑1 | Please note that the analysis below is meant to be simple and easy to understand. I invite others to look at the hypothesis and share their work. Perhaps more complex forms of analysis can provide more nuanced insights. The main point with this post is to get the conversation started and to ensure that we aren’t overweighting new evidence/stories vs. base rates a la bayesian analysis. |
|---|
About the Author: Wesley Gray, PhD
—
Important Disclosures
For informational and educational purposes only and should not be construed as specific investment, accounting, legal, or tax advice. Certain information is deemed to be reliable, but its accuracy and completeness cannot be guaranteed. Third party information may become outdated or otherwise superseded without notice. Neither the Securities and Exchange Commission (SEC) nor any other federal or state agency has approved, determined the accuracy, or confirmed the adequacy of this article.
The views and opinions expressed herein are those of the author and do not necessarily reflect the views of Alpha Architect, its affiliates or its employees. Our full disclosures are available here. Definitions of common statistics used in our analysis are available here (towards the bottom).
Join thousands of other readers and subscribe to our blog.