- Valeriy Zakamulin and Javier Giner
- Working paper, University of Agder and University of La Laguna
- A version of this paper can be found here
- Want to read our summaries of academic finance papers? Check out our Academic Research Insight category
What are the Motivations?
Despite the widespread popularity of trend-following investing, little is known about optimal trend-following with transaction costs. A few existing studies consider this question using a continuous-time model within the stochastic optimal control theory framework. However, despite being theoretically the most appropriate, this approach makes the problem intractable analytically, and the numerical solutions are extremely complex. Therefore, practical implementation of this model is hardly possible. Considering the aforementioned issues, there is an urgent need to develop a model representing an acceptable compromise between theoretical simplicity and practical relevance.
What are the Research Questions?
Trading rules based on moving averages of past prices are, without doubt, the prevalent trend-following rules used in practice. There are several types of rules and different kinds of moving averages. Traders are familiar with various trading indicators based on moving averages, and the moving average trading rules are implemented in just about any trading platform. Motivated by these considerations, our first research question is to find the optimal trend-following rule in the presence of transaction costs. Our second research question is to approximate the optimal trend-following rule by an existing trend-following rule.
What are the Theoretical Findings?
We formulate a discrete-time model where the financial asset returns follow a persistent autoregressive process. Instead of the price-based formulation of trend-following rules, we use an equivalent and more suitable return-based formulation. Our approach aims to determine the return weights of the trading indicator that maximizes the trend-following strategy’s performance in the presence of transaction costs. We show that our theoretical model produces a partly tractable optimization problem that can be solved numerically using standard and efficient optimization methods.
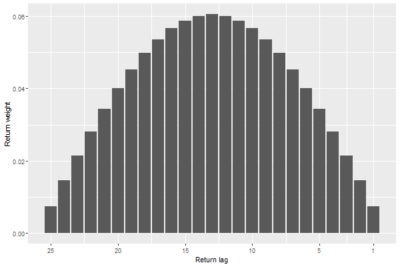
First, assuming that the trading indicator uses a given number of return lags, we determine the return weights of the trading indicator that minimizes trading costs. We show that the optimal return-weighting function has the shape of a semi-circle; see Figure 1 for an illustration.
The results are hypothetical results and are NOT an indicator of future results and do NOT represent returns that any investor actually attained. Indexes are unmanaged and do not reflect management or trading fees, and one cannot invest directly in an index.
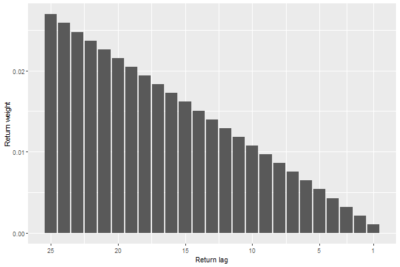
Second, before attacking the main problem of finding the optimal trend-following rule in the presence of transaction costs, we need to make a feasible assumption about the shape of the autoregressive coefficients of the real-life return process. The problem is that the empirical autoregressive coefficients are rather small and escape detection, see Zakamulin and Giner (2022a). On theoretical grounds (see Zakamulin and Giner [2022b]), one can assume that the autoregressive coefficients are linearly decreasing with the return lag; see Figure 2 for an illustration. It is worth emphasizing that the assumed autoregressive coefficients are the same as the return weights in the popular Simple Moving Average (SMA) rule. We demonstrate that the SMA rule represents the optimal trading rule without transaction costs.
The results are hypothetical results and are NOT an indicator of future results and do NOT represent returns that any investor actually attained. Indexes are unmanaged and do not reflect management or trading fees, and one cannot invest directly in an index.
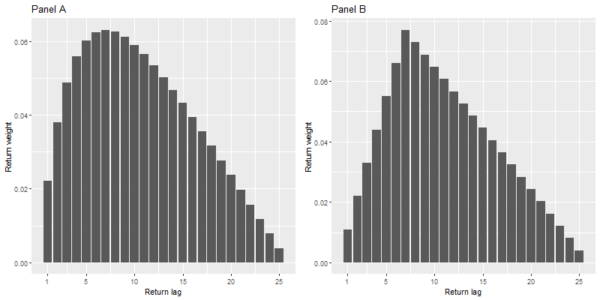
Third, under reasonable assumptions about the real-life return process, we solve numerically for the return weights of the optimal trend-following rule in the presence of transaction costs. The result is depicted in Panel A of Figure 3. The results of our numerical computations are very intuitive. In the absence of transaction costs, the shape of the return-weighting function of the optimal trading indicator resembles the shape of the autoregressive coefficients. When the trading costs are huge, the trading indicator minimizes the transaction costs, and the return-weighting function takes the shape of a semi-circle. In between these two extremes, when the transaction costs are neither negligibly small nor extremely large, the optimal return-weighting function has a hump shape between a linearly decreasing shape and a semi-circle shape. This shape can be well approximated by the return weights of an SMA crossover rule, see Panel B of Figure 3. Consequently, our model justifies using the crossover rules in practice.
The results are hypothetical results and are NOT an indicator of future results and do NOT represent returns that any investor actually attained. Indexes are unmanaged and do not reflect management or trading fees, and one cannot invest directly in an index.
Does the Empirical Evidence Support the Theoretical Results?
Yes, we validate the predictions of our theoretical model and demonstrate the advantage of the optimal trend-following with transaction costs using real-world data. We show that the results of this study are in satisfactory agreement with our theoretical model.
References:
Zakamulin and Giner (2022a), “Time Series Momentum in the US Stock Market: Empirical Evidence and Theoretical Analysis”, an open-access paper published in the International Review of Financial Analysis, available here
Zakamulin and Giner (2022b), “Optimal Trend Following Rules in Two-State Regime-Switching Models”, working paper available at the SSRN
About the Author: Valeriy Zakamulin
Valeriy Zakamulin is Professor of Finance at the School of Business and Law, University of Agder, Norway, where he teaches graduate courses in Finance. His first graduate academic degree is a MS in Radio Engineering. After receiving this degree, Valeriy Zakamulin had been working for many years as a research fellow at a computer science department, developing both computer hardware and software. Later on Valeriy Zakamulin received a MS in Economics and Business Administration and a PhD in Finance. He has published more than 30 articles in various refereed academic and practitioner journals and is a frequent speaker at international conferences. He has also served on editorial boards of several economics and finance journals. His current research interests cover behavioral finance, portfolio optimization, time-series analysis of financial data, financial asset return and risk predictability, and technical analysis of financial markets.
About the Author: Valeriy Zakamulin
—
Important Disclosures
For informational and educational purposes only and should not be construed as specific investment, accounting, legal, or tax advice. Certain information is deemed to be reliable, but its accuracy and completeness cannot be guaranteed. Third party information may become outdated or otherwise superseded without notice. Neither the Securities and Exchange Commission (SEC) nor any other federal or state agency has approved, determined the accuracy, or confirmed the adequacy of this article.
The views and opinions expressed herein are those of the author and do not necessarily reflect the views of Alpha Architect, its affiliates or its employees. Our full disclosures are available here. Definitions of common statistics used in our analysis are available here (towards the bottom).
Join thousands of other readers and subscribe to our blog.