This paper examines various frameworks and proxies for forecasting long-term expected returns (E(R)) over periods of 10 to 20 years, focusing on out-of-sample performance and the impact of these forecasts on investment decisions. It compares models based on yield, valuation, and the combination of both to identify the most effective methods for predicting E(R).
Time-Varying Drivers of Stock Prices
- Ma, Marshall, Nguyen, Visaltanachoti
- Financial Analyst Journal, 2024
- A version of this paper can be found here
- Want to read our summaries of academic finance papers? Check out our Academic Research Insight category
What are the Research Questions?
The main research questions addressed in this paper can be summarized as follows:
- What are the most effective frameworks and proxies for generating long-term expected returns (E(R)) forecasts over multiyear horizons (10 to 20 years)?
- How does the performance of these frameworks compare when evaluated out-of-sample (OOS), free from biases like look-ahead bias?
- Which specific proxies are the most consistent performers for the components used in these frameworks?
- How do these forecasting models impact investment decisions such as stock-bond portfolio allocations?
What are the Academic Insights?
By running run a horse race of the various frameworks and proxies used to generate long-term E(R) forecasts, the authors find:
- The most effective frameworks and proxies for generating long-term expected returns (E(R)) forecasts over multi-year horizons (10 to 20 years) identified in the paper are:
- Three-Component Model: Combining yield, growth, and valuation changes provides the best forecasts. This model, which uses the cyclically adjusted price-to-earnings ratio (CAPE) as a key valuation proxy, demonstrated consistent out-of-sample (OOS) performance improvements over historical mean forecasts. It reduces mean absolute errors (MAEs) and increases out-of-sample R-squared values significantly.
- Valuation Proxy (CAPE): The cyclically adjusted price-to-earnings ratio (CAPE) alone, which adjusts earnings over a long period to smooth out business cycle effects, proved to be the most reliable valuation proxy. This metric helps in capturing long-term valuation changes effectively, leading to better forecast accuracy for both 10-year and 20-year returns
- When evaluated out-of-sample, the three-component model, which combines yield, growth, and the cyclically adjusted price-to-earnings ratio (CAPE), shows significant improvements in forecast accuracy. It reduces mean absolute errors and increases out-of-sample R-squared values, demonstrating its robustness across different economic conditions and time horizons. In contrast, CAPE alone also performs well, providing reliable long-term predictions by mitigating look-ahead bias. However, models relying solely on yield or growth show less consistent performance, as they are more prone to biases from overlapping observations. The three-component model with CAPE remains the most effective framework for generating accurate long-term E(R) forecasts.
- They are:
- Cyclically Adjusted Price-to-Earnings Ratio (CAPE)-The CAPE ratio is the most reliable proxy for the valuation component. It adjusts the price-to-earnings ratio by using a long-term average of earnings, which helps smooth out the effects of economic cycles and provides a clearer picture of long-term valuation levels. Its consistent performance across multiple decades makes it a strong predictor of long-term E(R).
- Dividend Yield-Dividend yield serves as a consistent and important proxy for the yield component. Although its predictive power has been debated over shorter horizons, it remains a valuable component when used as part of the three-component model. Its effectiveness is enhanced when combined with valuation and growth components.
- Earnings Growth-The growth in dividends or earnings is crucial for the yield and growth component in the three-component model. While growth alone does not perform as well out-of-sample as when combined with other components, it still contributes positively to long-term E(R) forecasts, particularly in the context of the three-component model.
- They significantly influence stock-bond portfolio allocations. These models provide more accurate E(R) forecasts, which help investors make informed decisions about asset allocation. By predicting higher or lower expected returns from stocks, investors can adjust their portfolios to optimize the risk-return trade-off, improving overall portfolio efficiency and risk management. For instance, a portfolio based on these forecasts can achieve a higher Sharpe ratio and better value at risk, resulting in enhanced performance over multiyear horizons.
Why does this study matter?
This study matters because it addresses a critical gap in financial forecasting by improving the accuracy of long-term expected return (E(R)) predictions. By evaluating various frameworks and proxies out-of-sample, free from biases like look-ahead bias, it provides more reliable methods for investors to make informed decisions about asset allocations.
The Most Important Chart from the Paper:
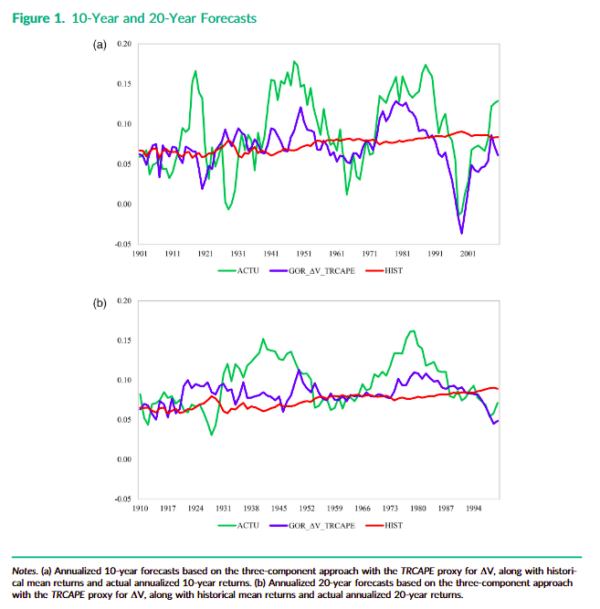
The results are hypothetical results and are NOT an indicator of future results and do NOT represent returns that any investor actually attained. Indexes are unmanaged and do not reflect management or trading fees, and one cannot invest directly in an index.
Abstract
Estimating long-term expected returns as accurately as possible is of critical importance. Researchers typically base their estimates on yield and growth, valuation, or a combined yield, growth, and valuation (“three-component”) framework. We run a horse race of the abilities of different frameworks and input proxies within each framework to estimate 10- and 20-year out-of-sample returns. The three-component model based on the TRCAPE valuation proxy outperforms estimates based on historical mean benchmark returns, with mean square error improvements exceeding 30%. Using this approach in asset allocation decisions results in an improvement in Sharpe ratios of more than 50%.
About the Author: Elisabetta Basilico, PhD, CFA
—
Important Disclosures
For informational and educational purposes only and should not be construed as specific investment, accounting, legal, or tax advice. Certain information is deemed to be reliable, but its accuracy and completeness cannot be guaranteed. Third party information may become outdated or otherwise superseded without notice. Neither the Securities and Exchange Commission (SEC) nor any other federal or state agency has approved, determined the accuracy, or confirmed the adequacy of this article.
The views and opinions expressed herein are those of the author and do not necessarily reflect the views of Alpha Architect, its affiliates or its employees. Our full disclosures are available here. Definitions of common statistics used in our analysis are available here (towards the bottom).
Join thousands of other readers and subscribe to our blog.