
For decades, when stocks zigged, bonds zagged, and the 60/40 investor slept like a baby. But over the past five years, bonds started doing something they hadn’t done in decades: consistently correlating to stocks. Worse, they’ve paired that newfound clinginess with disappointing returns. Higher correlation, worse performance.
And with debt sustainability concerns looming on the horizon, many investors are now asking: are bonds even worth keeping? And if not, where do we go for real diversification?
Our friends at AQR took it upon themselves to answer both questions in their piece, A Positive Stock-Bond Correlation Is a Terrible Reason to Add More Equity Risk to Your Portfolio. In this post, I’ll walk through their findings, along with some numbers I ran myself, so you can think more clearly about what any of this means for your portfolio.
Before starting, if you’d rather watch the video version of this blog, make sure to subscribe to our YouTube channel and check out the latest episode on this very topic.
Let’s begin.
Did Bonds Ever Really Diversify?
Here’s the thing: in theory, if inflation is fully tamed by monetary policy, bonds should almost always be negatively correlated to stocks. But theory is not reality. And while bonds have certainly been “getting it” as of late, I wondered how much of this experience is actually new.
So I ran the numbers.
Thankfully, we have almost exactly 100 years of data from the Kenneth French dataset to test how the classic 60/40 has done at the main job investors hired it for: diversification.
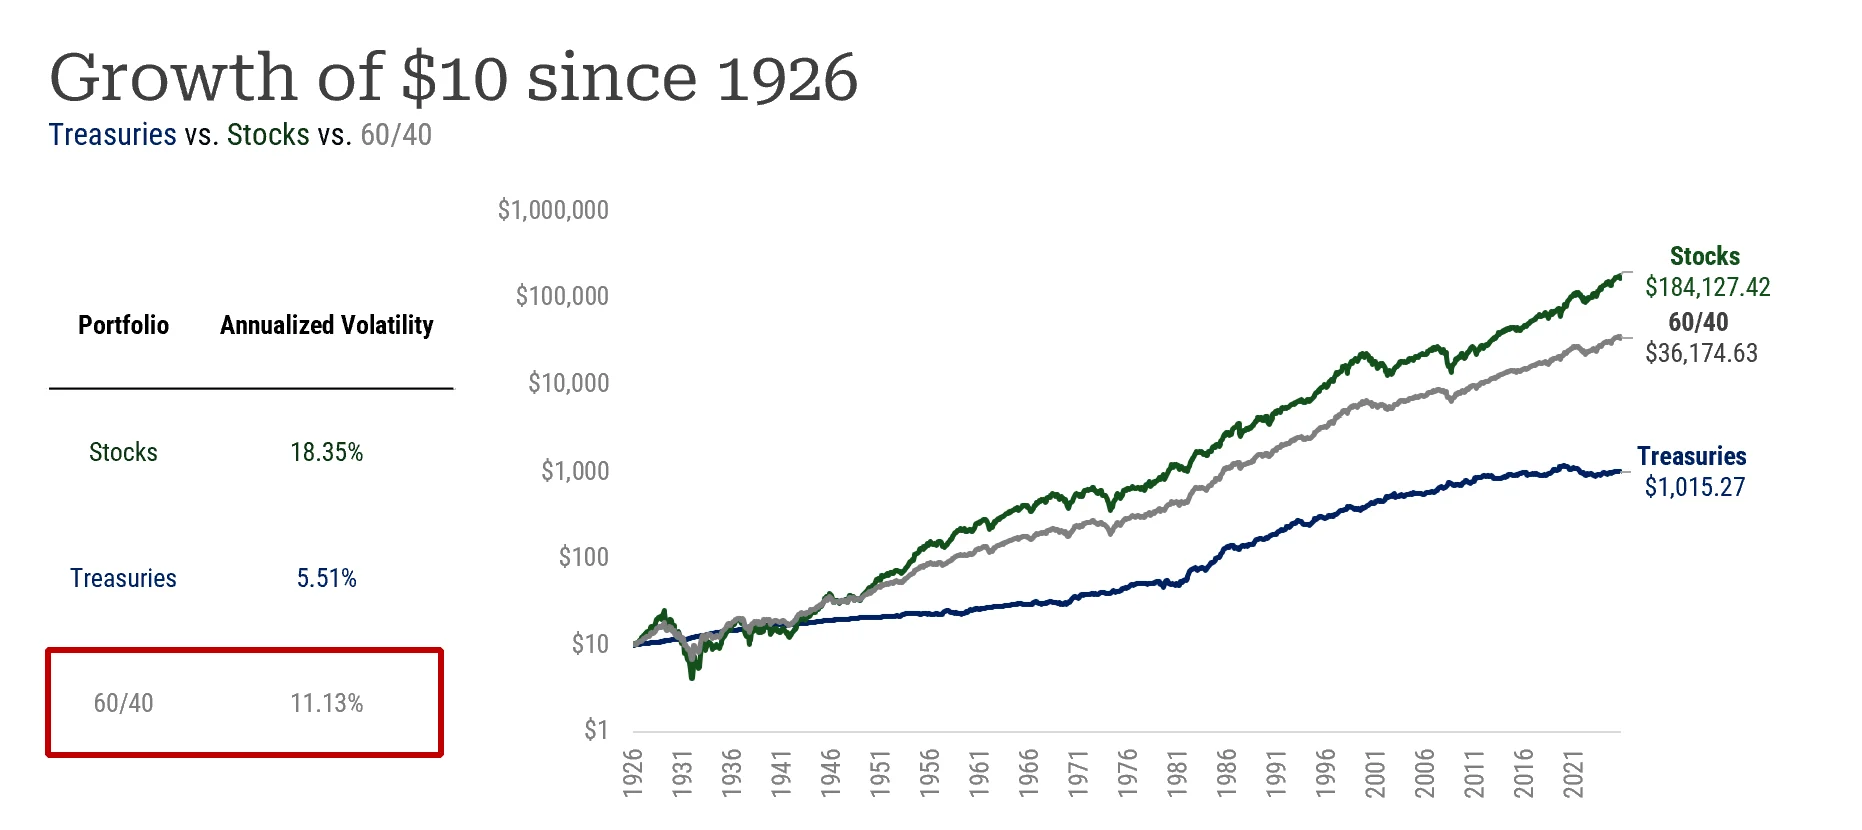
Historically, U.S. stocks have delivered annualized volatility of 18.35%, while bonds came in at 5.51%. The 60/40, on the other hand, had a realized volatility of 11.13%. But is that any good? A quick test we could run is to calculate the portfolio’s realized volatility and compare it against its ex-ante weighted-average volatility. If the realized volatility is meaningfully lower than a simple weighted average would predict, then we can conclude that bonds did indeed provide some level of diversification.
If you’re curious, that weighted average is 13.22%. Do the math, and the 60/40 has historically delivered roughly 16% less volatility than the naïve estimate would predict. Great! It does seem that bonds have been a diversifying asset.
But What About the Post-2022 World?
Before you conclude those were simply “the good old days” when bonds used to diversify stocks, let’s re-run the numbers again, this time starting at one of the worst possible dates in three decades: 2022.
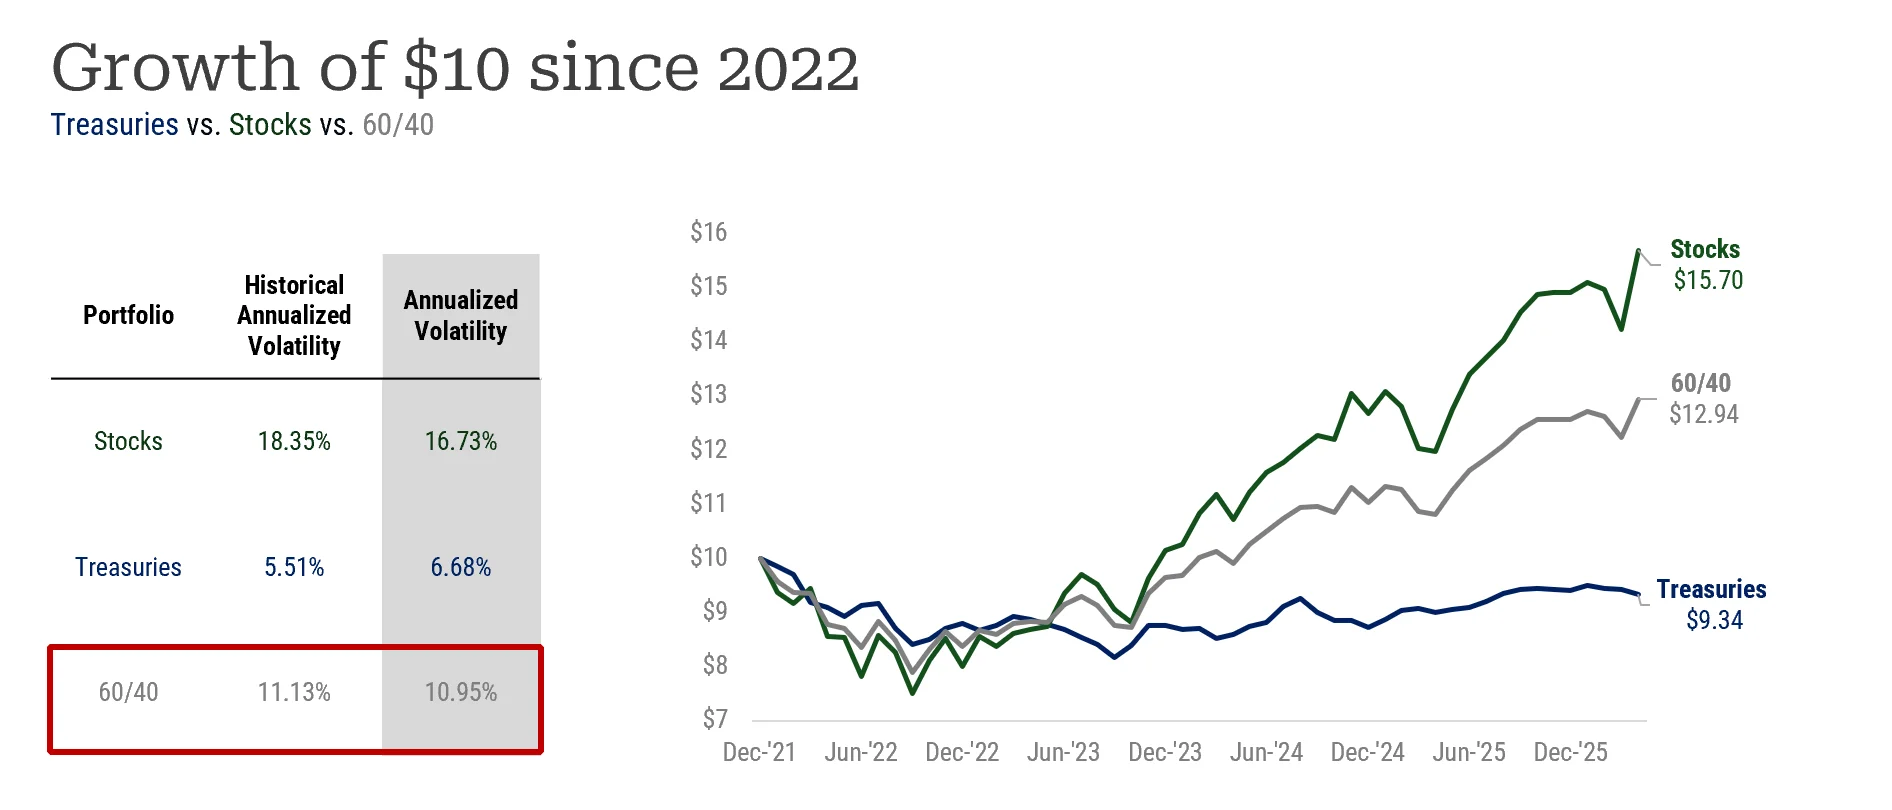
Since 2022, bond volatility has picked up (6.68% vs. 5.51% historically) while stock volatility actually went down (16.73% vs. 18.35%). And the 60/40? A volatility of 10.95% which is… not that different from its 11.13% historical reading.
Translation: yes, the diversification benefits are more muted today. But they are not that different from their long-term average.
The 60% Stocks/ 40% Bonds portfolio
Okay, but surely a 60/40 with bonds is leagues ahead of parking that 40% in cash, right? Well: the bond version compounded at roughly 8.55%, the cash version at 7.9%. The Sharpe ratios? 0.56 versus 0.51. Bonds come out ahead, and while 65 basis points does meaningfully compound over time, it’s not exactly a home run.
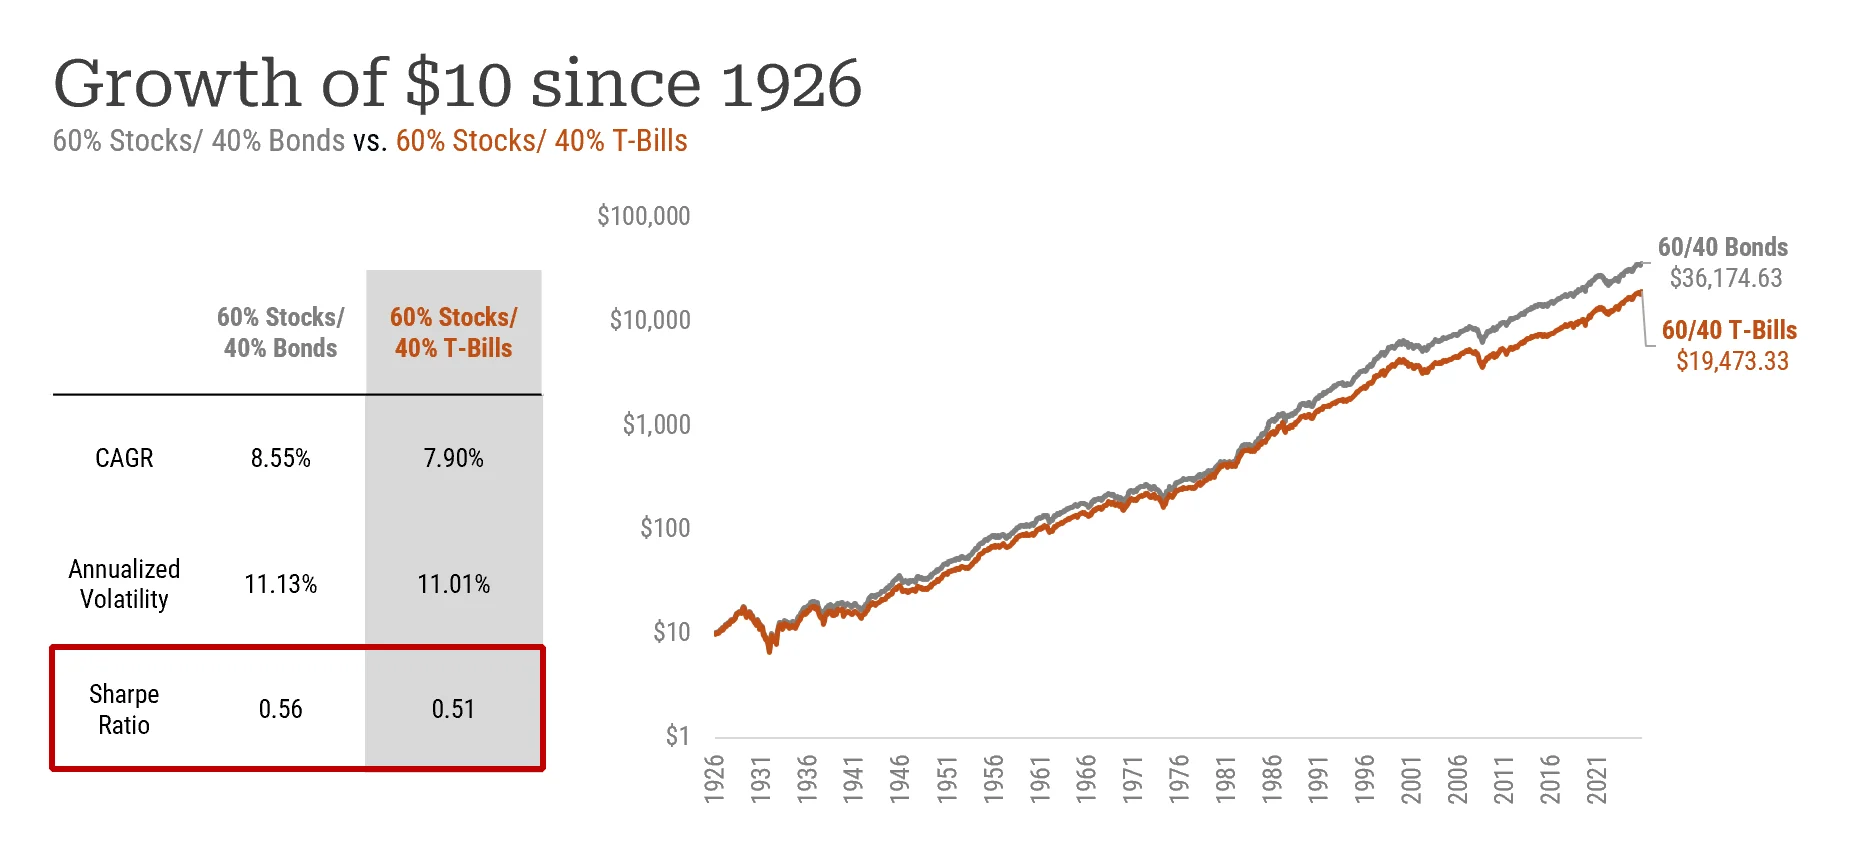
The AQR team’s core argument is that bonds dilute returns more than they diversify stocks. Why? Because 60/40 returns are overwhelmingly carried by the equity sleeve. In fact, according to the piece, “in 49 of the last 50 years in which the S&P 500 lost money, a U.S. 60/40 portfolio lost money too.”
There have been countless articles asking whether the 60/40 is dead. But they never really ask if it was alive to begin with.
The Popular (and Crummy) Replacements
So investors are shopping for substitutes. The paper examines three of today’s most popular candidates: private credit, buffered products, and yes, crypto.
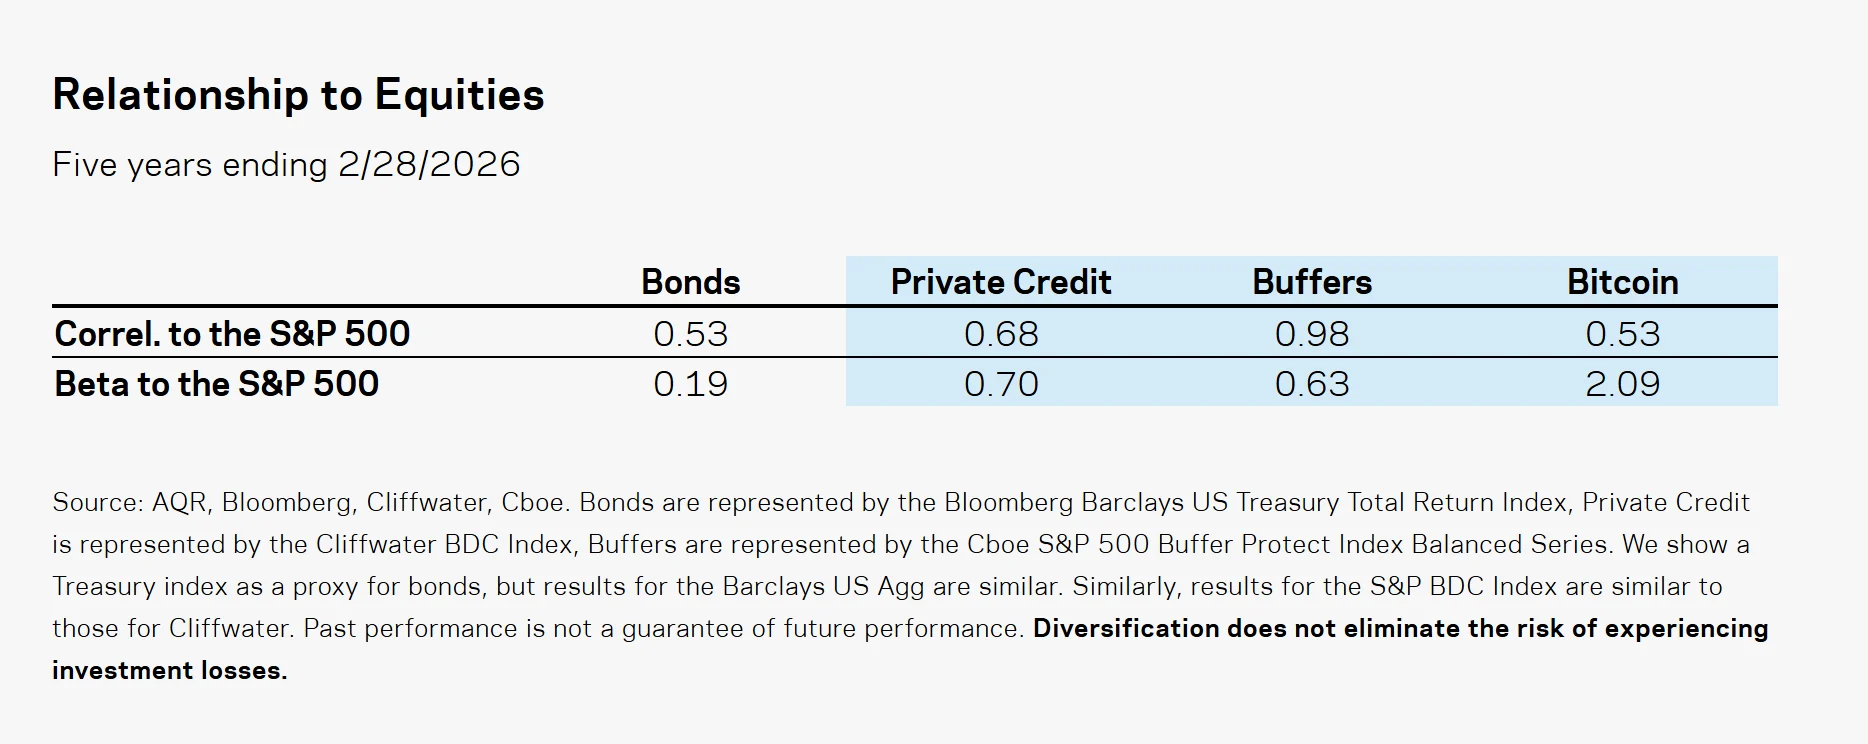
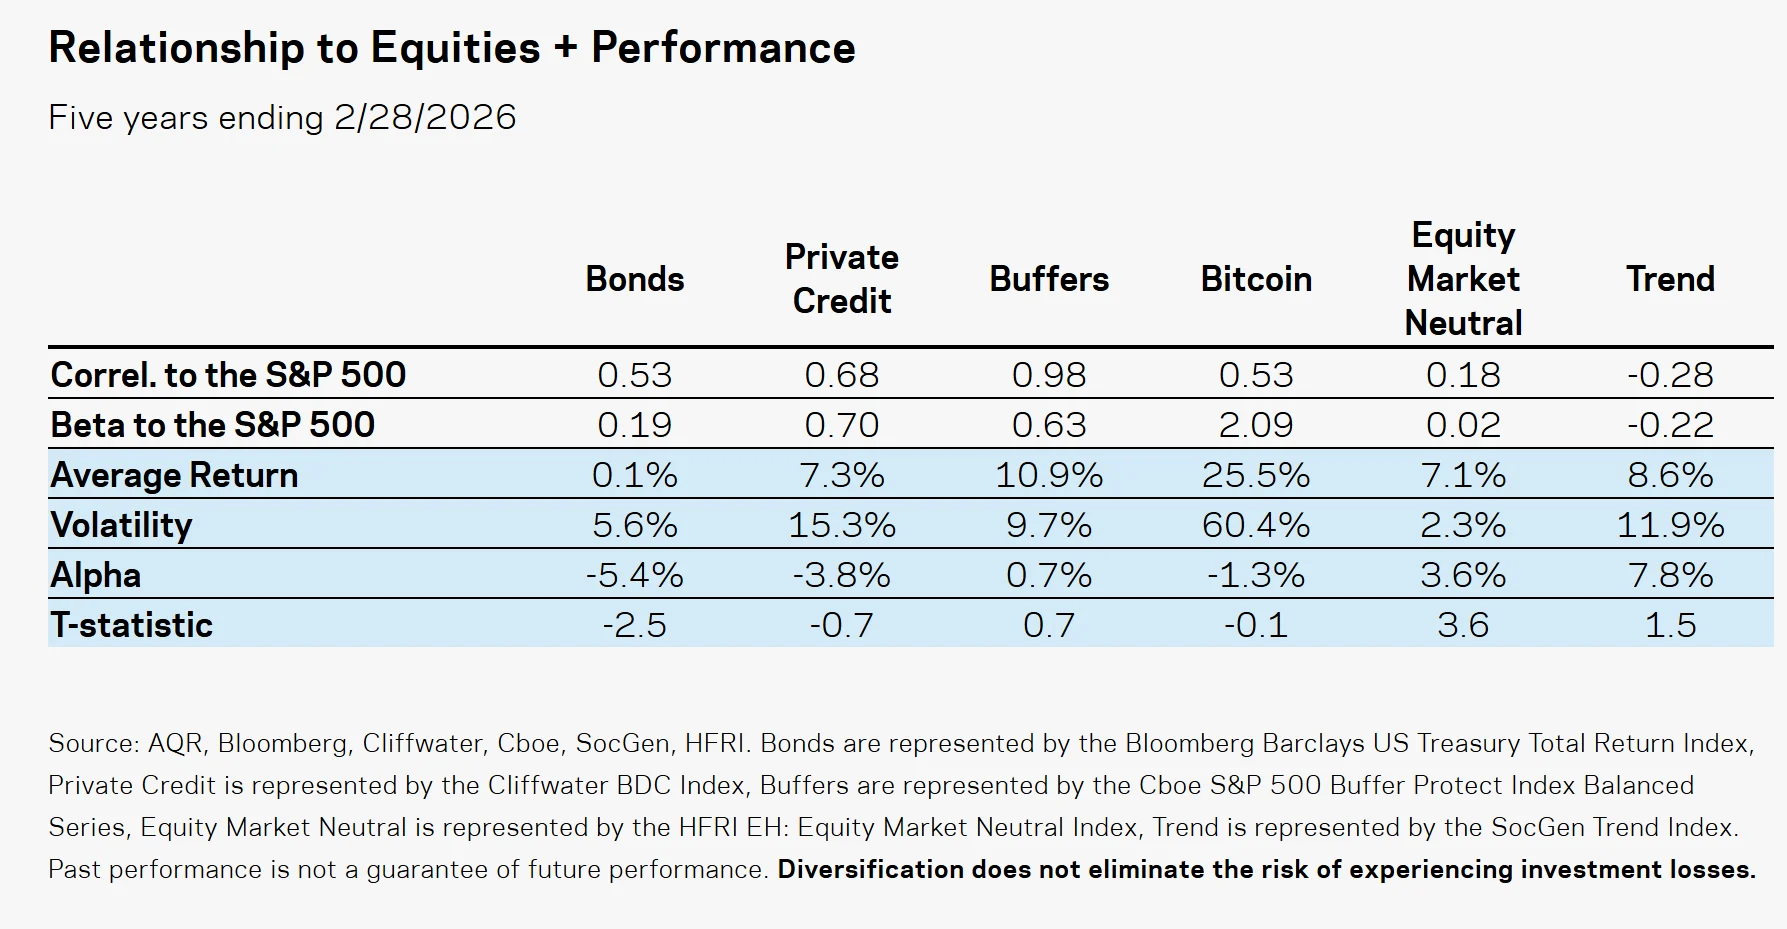
The verdict is not kind. Buffers carry a 0.98 correlation to stocks—yet another sign that buffer returns can largely be recreated with stocks and cash. Private credit sports a 0.70 beta. And bitcoin, the “least correlated” of the three, packs a beta of 2.09. After adjusting for those betas, both private credit and bitcoin have delivered negative alpha. You’re getting worse outcomes for the risk taken. Yikes.
Where True Diversifiers Live
The authors point to two better candidates:
- Equity market neutral. By going long stocks expected to beat the market and shorting those expected to lag, you can harvest factor premia at near-zero beta. This is definitionally distinct from the market.
- Trend following. By buying what’s rising and selling what’s falling, you can seek returns tied to macroeconomic disruptions.
Over the past five years, both have delivered what bond investors have been missing: correlations and betas near zero or outright negative, with positive alpha to boot.
So… Are Bonds Dead?
Now, I know it looks like I wrote this post just to bash bonds. But that’s (exactly) not why I’m here. The lesson isn’t to run to sell your bonds. But if a positive stock-bond correlation has you questioning your allocation, then apply a high diversification bar to whatever you buy next. You will be surprised as to how most popular alternatives fail that bar spectacularly.
Source: Asness, Cliff, Daniel Villalon, and Antti Ilmanen. “A Positive Stock-Bond Correlation Is a Terrible Reason to Add More Equity Risk to Your Portfolio.” AQR Capital Management, April 8, 2026.
About the Author: Jose Ordonez

—
Important Disclosures
For informational and educational purposes only and should not be construed as specific investment, accounting, legal, or tax advice. Certain information is deemed to be reliable, but its accuracy and completeness cannot be guaranteed. Third party information may become outdated or otherwise superseded without notice. Neither the Securities and Exchange Commission (SEC) nor any other federal or state agency has approved, determined the accuracy, or confirmed the adequacy of this article.
The views and opinions expressed herein are those of the author and do not necessarily reflect the views of Alpha Architect, its affiliates or its employees. Our full disclosures are available here. Definitions of common statistics used in our analysis are available here (towards the bottom).
Join thousands of other readers and subscribe to our blog.