New academic research explains how retail investors’ own psychology turned the COVID trading boom into a wealth-destroying machine — and what it means for you.
Research Summary & Commentary
Remember early 2021? Millions of people were stuck at home, interest rates were near zero, stimulus checks were hitting bank accounts, and Robinhood had just made it free and effortless to trade stocks from a phone. GameStop shot up 1,700% in weeks. AMC, BlackBerry, Bed Bath & Beyond — the whole MEME universe was on fire. It felt like a new era of investing. For a lot of retail investors, it ended in significant losses.
A newly published academic paper offers an explanation for what happened — and why it will probably happen again. The framework they use is called prospect theory, and once you understand it, you’ll never look at a hot stock the same way.
What the Researchers Examined
Xu Guo, Junbo Wang, Chunchi Wu, and Xiaoling Zhong, authors of the study “Prospect Theory and Stock Price Behavior in Retail Trading Booms,” published in the June 2026 issue of The Journal of Empirical Finance, set out to test whether a 40-year-old psychological theory of decision-making could explain the wild stock market behavior of the COVID-19 pandemic—an excellent laboratory to test behavioral models as retail investors flocked into financial markets when lockdowns limited social interactions, and individuals speculated in markets to fend off the boredom through online trading.
Their dataset covered over 2.7 million firm-month observations for nearly 23,000 companies stretching back to 1965, with special focus on the pandemic period from March 2020 to March 2022.
Prospect theory, originally developed by Nobel laureate Daniel Kahneman and Amos Tversky, describes how real people make decisions under uncertainty — as opposed to how economists used to assume we’d behave. The theory rests on three pillars:
1. Loss Aversion
Losses hurt about twice as much as equivalent gains feel good. Losing $100 is psychologically more painful than winning $100 is pleasurable. This makes investors behave asymmetrically — they’ll take big risks to avoid locking in a loss, even when it doesn’t make financial sense.
2. Probability Weighting
People systematically overestimate the chances of rare but dramatic outcomes. The tiny probability of a stock going up 500% feels much larger in our minds than it is. This is the “lottery ticket” effect — we are wired to chase long shots and overvalue them.
3. Concavity/Convexity (Diminishing Sensitivity)
The more you win or lose, the less each additional dollar feels. Going from $0 to $100 feels great. Going from $1,000 to $1,100 feels less impactful. This creates a curve in how we perceive gains and losses rather than a straight line.
The researchers combined all three factors into a single score for each stock called the Prospect Theory Value (PTV). A high PTV means a stock looks “lottery-like” to the human brain — it has characteristics that make our psychological biases light up. The researchers then asked: do high-PTV stocks deliver good returns? And does that change when retail investors flood the market?
Key Findings
High-PTV Stocks Became Badly Overpriced
When retail investors poured into the market during the pandemic, they overwhelmingly bought the stocks that “felt” exciting — high volatility, high skewness, and strong recent momentum. These are all hallmarks of high-PTV stocks. As demand surged, prices were pushed well above what fundamentals justified. The market-to-book ratios of high-PTV stocks shot up dramatically more than those of boring, low-PTV stocks.
Overpricing Led to Sharp Reversals
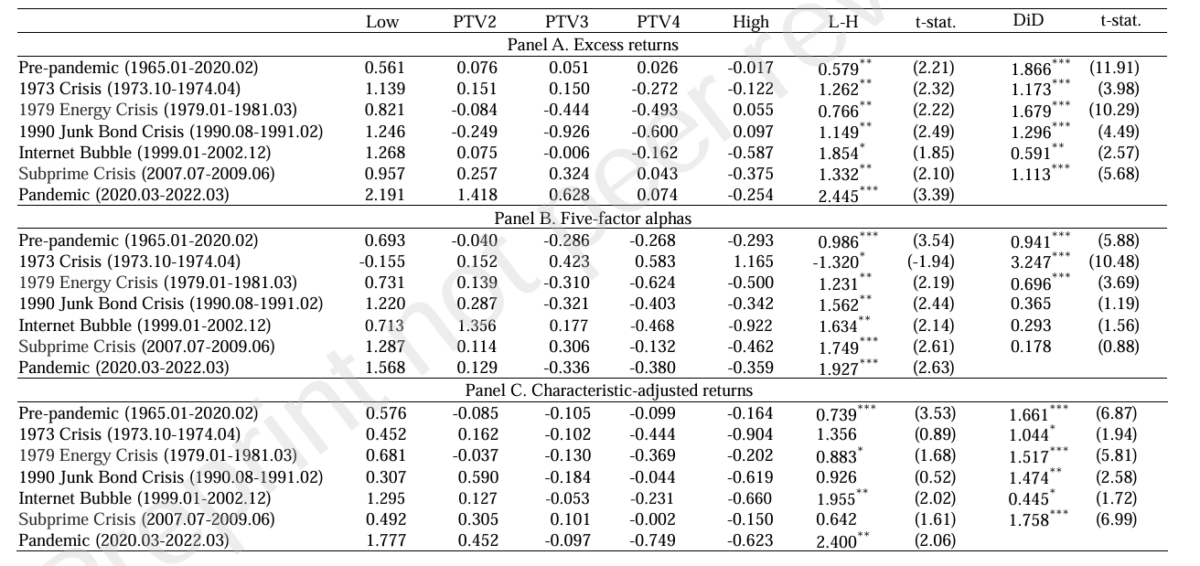
Stocks that get pushed too high tend to come back down hard. The researchers found that a simple strategy — owning the lowest-PTV stocks and avoiding the highest-PTV stocks — earned a statistically significant (at the 1% confidence level) 2.45% per month during the pandemic. Before the pandemic, the same strategy earned a respectable, but more modest 0.58% per month (statistically significant at the 5% confidence level)—the gap more than quadrupled.
“The PTV premium is much higher for the coronavirus crisis period than for any other crisis period. The differences are closely linked to the level of retail investor interest.”
This Was Unlike Any Previous Crisis
The paper compared COVID to five other major U.S. financial crises: the 1973 oil shock, the 1979 energy crisis, the 1990 junk bond collapse, the 2001 internet bubble, and the 2008 subprime meltdown. In every prior crisis, the PTV effect existed but was more modest — the monthly return spread between low and high-PTV stocks ranged from about 0.77% to 1.85% versus 2.45 during the pandemic.
The key difference? During COVID, retail trading as a share of total market volume averaged around 21%, spiking to 25% on peak days. In every prior crisis, that number was below 5%. More first-time, emotionally-driven retail investors meant more behavioral bias. The result was that mispricing was deeper and more widespread.
The Effect Was Strongest Where Arbitrage Was Hardest
Rational investors — hedge funds, institutions — theoretically should swoop in and correct overpricing. However, they faced constraints. The research confirms that the PTV effect was strongest in stocks where it was most costly and risky to bet against the crowd: small-cap stocks, illiquid stocks, highly volatile stocks, and stocks with low institutional ownership (thus few shares available to borrow, making it harder for skeptics to bet against them). Where the “smart money” couldn’t easily push back, retail-driven mispricing festered longest.
Even Risk-Adjusted Returns Were Striking
The Fama-French 5-factor alpha (beta, size, value, momentum, and profitability) of the monthly low-minus high PTV portfolio was 1.93% (t-stat = 2.6) for the pandemic period, and 0.99% (t-stat = 3.3) for the pre-pandemic period.
Social Media, Robinhood, and Stimulus Checks All Fanned the Flames
The paper identifies the four amplifiers that made the pandemic era uniquely dangerous for retail investors: Reddit, Twitter, and other finance social media platforms that spread attention-driven hype; commission-free fintech brokerages like Robinhood that made it effortless to trade; unusually high investor sentiment; and the direct injection of stimulus check cash into the market. About 10–15% of stimulus payments found their way into stocks — and a Deutsche Bank survey found that Robinhood users planned to invest 37% of their checks in equities.
MEME Stocks Were the Extreme Case
The researchers specifically analyzed the most famous pandemic darlings — GameStop, AMC, Tesla, and dozens more. For MEME stocks, the PTV effect was on another planet entirely. During the pandemic, the monthly return spread between low-PTV and high-PTV MEME stocks was an astonishing 12.29%, versus 2.45% for the broader market. In other words, the gap between “boring” and “exciting” MEME stocks was five times wider than the gap in the general market. Loss aversion and probability weighting — the lottery-ticket instinct — were the dominant drivers.
Table 3. Returns of PTV Portfolios This table reports the equal-weighted excess returns (in percent), the five-factor alpha, and the characteristic-adjusted return of quintile and L H portfolios during the pre-pandemic and pandemic periods, sorted by prospect theory value (PTV) of a stock’s historical return distributions. We also report the results for the five historical crises over the long-span pre-pandemic period. The L-H is the average return of a portfolio that longs the stocks in the lowest quintile and shorts the stocks in the highest quintile. The excess return in Panel A is the return in excess of the equal-weighted market return. The five-factor alpha in Panel B is the returns adjusted by Fama-French’s five factors. The characteristic-adjusted return in Panel C is the return adjusted by characteristic variables, Size, BM, and MOM. The column of DiD reports the difference in L-H returns/alphas between the pandemic and other benchmark periods. The t-statistics are reported in parentheses, and *, **, and *** indicate significance at the 10%, 5%, and 1% levels, respectively.
The results are hypothetical results and are NOT an indicator of future results and do NOT represent returns that any investor actually attained. Indexes are unmanaged and do not reflect management or trading fees, and one cannot invest directly in an index.
Taken together, these findings paint a consistent picture: retail psychology, not fundamentals, was driving prices.
Why This Matters — The Psychology Behind It
Here’s the cruel irony prospect theory reveals: the stocks that our brains find most compelling are systematically the ones that underperform the most. We’re drawn to high-flyers with explosive past returns, extreme volatility (which we read as “opportunity”), and positive skewness (the chance — however small — of a giant payday). That’s exactly what a high-PTV stock looks like. And because thousands of retail investors are drawn to the same stocks for the same psychological reasons, they collectively push prices up to levels that can’t be sustained.
The “lottery ticket” framing is especially revealing. When an investor looks at a stock trading at $5 that could theoretically hit $100, the brain treats that tiny probability of a 20x return as more exciting than it rationally should be. Casinos understand this. So do scratch ticket manufacturers. And so do behavioral economists.
The researchers also found that probability weighting was the most powerful of the three psychological components — even stronger than loss aversion. The human tendency to overweight small probabilities of extreme outcomes isn’t just a quirk. During retail trading booms, it’s a return-destroying force operating at market scale.
Their findings led the authors to conclude: “The influx of retail investors leads to overpricing high PTV stocks and subsequent lower returns.”
Key Investor Takeaways
If everyone on Reddit is excited about it, be careful
Social media attention is one of the strongest predictors of a high-PTV stock — and high-PTV stocks systematically underperform. Mass excitement is a contrary indicator, not a buy signal. The more a stock trends on financial social media, the more it may already be overpriced.
Your brain is wired to love the worst investments
High volatility, recent explosive gains, and the chance of a big payday are features that make stocks feel exciting — and also overpriced. Recognize the feeling of “this could be huge” as a potential warning sign, not a green light. The lottery-ticket stocks have already had their prices bid up by everyone else who felt the same way.
Boring works — especially during trading frenzies
The research shows that low-PTV stocks — the unglamorous, steady, lower-volatility names — dramatically outperformed during the pandemic. “Boring” stocks are under-owned by retail investors. In a world where excitement is systematically overvalued, dullness is a competitive advantage.
The effect didn’t disappear when the pandemic ended
The researchers found that this dynamic existed before COVID — the pandemic just turbocharged it. As long as retail investors participate heavily in markets (aided by today’s low-cost trading infrastructure) PTV will have predictive power. The lesson isn’t just a COVID postmortem; it’s an ongoing guide to avoiding behavioral traps.
For financial advisors: this is why client behavior is so hard to correct
Your clients are predictably human. Prospect theory is baked into how our brains process risk and reward. Understanding this means framing conversations differently: not “stop chasing hot stocks” but “here’s the psychological trap that cost retail investors billions, and here’s a way to systematically avoid it.” Data and framing beat lectures every time.
Watch out for the next retail boom — the playbook will repeat
The researchers found that the PTV premium rises and falls with retail participation. When a new wave of novice investors enters the market — triggered by the next crisis, the next easy-money era, the next viral trading app — the same overpricing dynamic will re-emerge. Knowing this in advance is a meaningful edge.
The Bottom Line
The COVID retail trading boom wasn’t just a quirky episode in financial history. It was a real-world experiment that confirmed, at massive scale, a core truth of behavioral finance: human psychology systematically misprices certain kinds of stocks. The stocks that feel most exciting to buy are — on average, over time — the worst ones to own. The stocks that feel dull and uninspiring are — on average, over time — the best ones to hold.
This paper’s lasting contribution is showing us that this isn’t just a laboratory finding. The best protection is simple: The house always wins. The good news: knowing the game means you don’t have to play it.
Larry Swedroe is the author or co-author of 18 books on investing, including his latest Enrich Your Future. He is also a consultant to RIAs as an educator on investment strategies. This article is for informational and educational purposes only and should not be construed as specific investment, accounting, legal, or tax advice.
About the Author: Larry Swedroe
—
Important Disclosures
For informational and educational purposes only and should not be construed as specific investment, accounting, legal, or tax advice. Certain information is deemed to be reliable, but its accuracy and completeness cannot be guaranteed. Third party information may become outdated or otherwise superseded without notice. Neither the Securities and Exchange Commission (SEC) nor any other federal or state agency has approved, determined the accuracy, or confirmed the adequacy of this article.
The views and opinions expressed herein are those of the author and do not necessarily reflect the views of Alpha Architect, its affiliates or its employees. Our full disclosures are available here. Definitions of common statistics used in our analysis are available here (towards the bottom).
Join thousands of other readers and subscribe to our blog.