This paper reveals a striking pattern in U.S. stock markets: the prices of individual stocks often reverse direction at the very end of the trading day. Using high-frequency data, the authors find that the last few minutes—particularly the closing auction—are dominated by large institutional flows that cause temporary price pressure. This is followed by a reversal the next day. This “end-of-day reversal” effect is systematic and persistent. It highlights how liquidity constraints and trade timing, not fundamentals, can create short-term price distortions. These findings have implications for portfolio rebalancing, ETF trading, and even alpha strategies targeting microstructure inefficiencies.
End of Day Reversal
- Baltussen, Da and Soebhag
- Working paper, 2025
- A version of this paper can be found here
- Want to read our summaries of academic finance papers? Check out our Academic Research Insight category
Key Academic Insights
Closing Trades Have Outsized Impact
The closing auction contributes disproportionately to daily returns due to concentrated trading volumes. This distorts prices in the final minutes of the day.
Reversals Are Predictable and Widespread
Stocks that experience large price changes in the last 30 minutes of trading often exhibit an opposite return the following day—suggesting price pressure, not information, drives the move.
Institutional Trading and Index Flows Drive the Effect
The need for funds to execute large trades at the close (to track NAV or benchmark indices) contributes to transient mispricings that are reversed later. This mirrors evidence from our deep dive on index rebalancing, which shows how stocks added to or deleted from indices often experience short-term distortions around the close that are reversed shortly after.
Microstructure Matters
Market structure—like auction rules and liquidity at the close—can create opportunities or risks not explained by fundamental analysis or traditional factor models.
Practical Applications for Investment Advisors
Be Cautious with End-of-Day Execution
If you’re implementing trades near the close, especially around rebalance dates, be mindful of potential price dislocations. Consider volume-weighted or earlier execution windows.
Rebalance Thoughtfully
Advisors using models that rebalance daily or monthly at market close may unintentionally expose clients to these short-term reversals. Staggering rebalancing could mitigate that.
Evaluate ETF Tracking Risks
Since ETFs also trade heavily at the close to sync with NAV, this effect could lead to tracking error, especially in thinly traded names or small-cap ETFs.
How to Explain This to Clients
“You’ve probably heard that prices at the end of the day reflect all the news. But research shows that the final minutes are often more about big players racing to meet deadlines—causing prices to briefly move too far. The next day, they often snap back. That’s why how and when we trade matters, not just what we buy.”
The Most Important Chart from the Paper
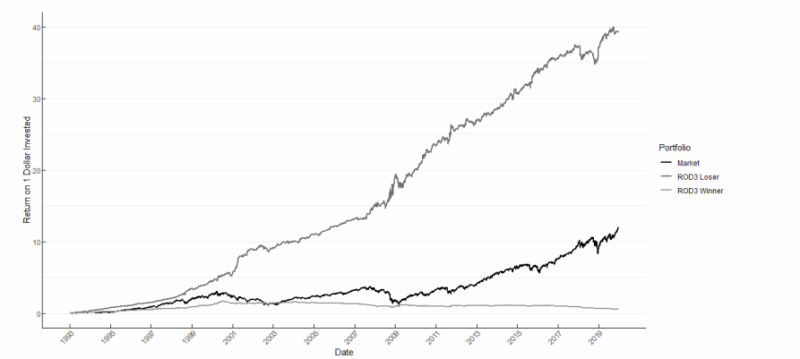
Figure 4: End-of-day reversal: cumulative strategy returns.
This figure shows the cumulative performance of decile portfolios formed on the ”rest-of-day”
(ROD3) return, which is the return between market close at day t − 1 till 3:00pm at day t. At
3:30pm of each day t we sort stocks into five portfolios based on their ROD3 return on day t,
and hold this portfolio intraday from 3:30pm until 4:00pm (i.e., market close). The dark (light)
grey line shows the return for ROD3 loser (winner) decile. The black line shows the return on
the daily market portfolio held throughout the day, as obtained from Kenneth French’s data
library. The sample consists of stocks listed on NYSE/AMEX/NASDAQ for the period between
January 1993 and December 2019 with share code 10 or 11, with prices above $5. We exclude
stocks below the 10th NYSE size percentile. Stocks are weighted by their previous day’s market
capitalization.
The results are hypothetical results and are NOT an indicator of future results and do NOT represent returns that any investor actually attained. Indexes are unmanaged and do not reflect management or trading fees, and one cannot invest directly in an index.
Abstract
Individual stocks experience sharp intraday return reversals in the cross-section during the
last 30 minutes of the trading day. This ”end-of-day reversal” pattern is economically and
statistically highly significant, is distinct from market intraday momentum, and primarily
comes from positive price pressure on intraday losers. The effect cannot be explained by
liquidity – or gamma-hedging effects. Instead, two novel channels related to attention-induced
retail purchases and risk management by short-sellers at the end of the day are driving the
effect.
About the Author: Elisabetta Basilico, PhD, CFA
—
Important Disclosures
For informational and educational purposes only and should not be construed as specific investment, accounting, legal, or tax advice. Certain information is deemed to be reliable, but its accuracy and completeness cannot be guaranteed. Third party information may become outdated or otherwise superseded without notice. Neither the Securities and Exchange Commission (SEC) nor any other federal or state agency has approved, determined the accuracy, or confirmed the adequacy of this article.
The views and opinions expressed herein are those of the author and do not necessarily reflect the views of Alpha Architect, its affiliates or its employees. Our full disclosures are available here. Definitions of common statistics used in our analysis are available here (towards the bottom).
Join thousands of other readers and subscribe to our blog.