Academics have identified hundreds of factors that supposedly explain stock returns. New research shows most of them are telling the same story in different words — and only a few truly distinct forces actually drive the market. The problem: too many factors, too little meaning.
Over the past few decades, academic researchers have proposed more than 400 factors — characteristics or variables, to explain why some stocks earn higher returns than others. There are value factors, momentum factors, profitability factors, macroeconomic factors, and dozens more. For retail investors and advisors trying to build portfolios around sound economic principles, the sheer volume of these factors has become a problem.
If every factor offered a genuinely different explanation for returns, a portfolio builder would need to track hundreds of variables simultaneously. And when a new factor is proposed, how do you know if it truly represents a new insight or is just a repackaging of something already known?
In our 2016 book, “Your Complete Guide to Factor-Based Investing,” Andrew Berkin and I addressed this problem by establishing six criteria that all had to be met for a factor to be considered for investment: there was a statistically significant premium that had to be persistent across economic regimes; pervasive across sectors, countries, regions, and where appropriate asset classes; robust to various definitions; able to survive transaction costs; and supported by risk-based or behavioral explanations for why the premium was likely to persist. Applying these criteria left us with just five equity factors: beta, size, value, profitability/quality, and momentum.
Jiantao Huang, Christian Julliard, and Ran Shi, authors of the April 2026 paper “Factor Identity,” addressed the same problem of factor proliferation with a novel statistical approach.
What the Researchers Examined
The authors looked at three broad categories of factors used in asset pricing — the field of economics that tries to explain why different assets earn different returns over time.
- Macroeconomic factors: GDP growth, industrial production, consumption, unemployment, total factor productivity (TFP), hours worked
- Characteristic-based factors: Fama-French five factors, momentum, size, value, profitability, q-factors, mispricing (behavioral-based) factors
- Statistical (latent) factors: Principal components and risk-premia principal components extracted directly from return data. Principal component analysis is a statistical technique used to reduce the dimensionality of large datasets while preserving as much original information as possible — it transforms a set of correlated variables into a smaller set of uncorrelated variables called principal components. They applied a new Bayesian statistical method — an approach that treats probability as a degree of belief in a hypothesis, which is then updated as new evidence becomes available — to a large cross-section of 102 stock portfolios from January 1974 to December 2019, testing which factors truly carry distinct pricing information and which are essentially redundant substitutes for each other.
The Key Concept: Factor Identity
Huang, Julliard, and Shi introduced the concept of a factor identity: a group of factors that convey the same pricing information for the cross-section of expected returns, even when their pairwise time-series correlations are modest. Two factors share an identity if the risk exposures they generate across assets are close substitutes — the data cannot distinguish their separate contributions to expected returns, and it is meaningless to designate either one alone as the driver of risk premia.
By mapping the factor zoo into its underlying identities, the method provides a principled test for new theories: a proposed state variable adds genuine economic content if, and only if, it introduces an identity not already spanned by the existing pricing groups.
The Central Finding: Dense Zoo, Sparse Species
The headline result is striking. Despite hundreds of proposed factors, when you strip away the redundancy, only a small number of genuinely distinct economic forces drive the cross-section of stock returns. As the authors put it: the factor zoo is dense in animals, but its animals belong to just a handful of species.
The Three Main Identities
Identity 1: The Macro Identity
Long-horizon growth in GDP, industrial production, and nondurable consumption all tell the same story — but only when measured over 12 quarters (three years), not at the quarterly frequency.
Identity 2: The Market / Level Identity
The market portfolio pins down the overall level of risk premia. It doesn’t explain which stocks earn more than others — it captures the broad price investors demand to hold equities at all.
Identity 3: The Latent Statistical Identity
A small number of statistical components extracted from return data capture residual pricing variation that isn’t yet attributable to observable economic fundamentals.
Five Specific Findings Worth Knowing
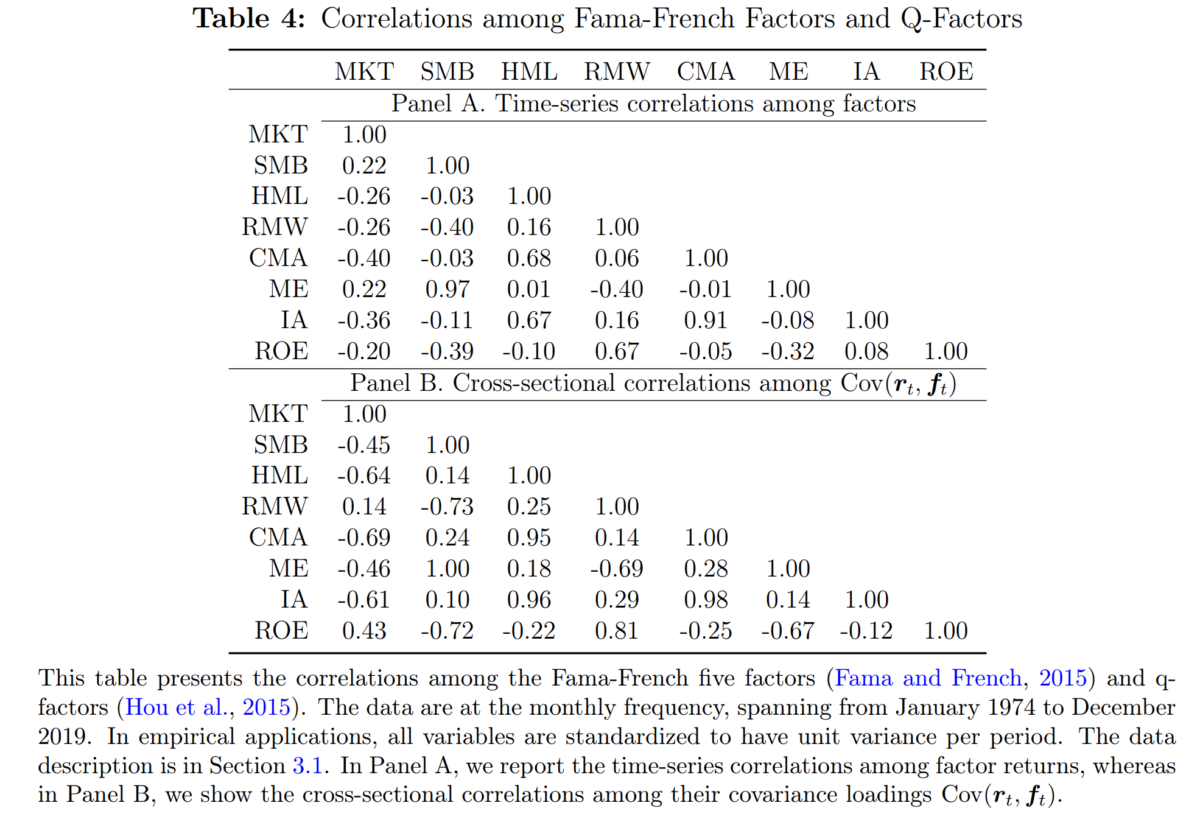
1. Value and investment factors are the same thing.
The Fama-French value factor (HML) and investment factors (CMA from Fama-French, IA from the q-factor model) all fall into a single pricing identity. Their cross-sectional loadings on portfolios correlate at roughly 95%, even though their time-series returns only correlate around 67%. This confirms a theoretical prediction from investment-based asset pricing: book-to-market and investment both proxy for the same underlying mix of assets in place versus growth options.
2. The market portfolio is a ‘level factor’—a factor whose cross-sectional exposures are nearly the same for every asset, so it mainly shifts expected returns up or down by a common amount rather than explaining differences across assets.
The market portfolio has nearly the same covariance with every asset in the cross-section, which makes it impossible to distinguish from a pure intercept term in pricing regressions. This explains the well-known empirical finding that the security market line is too flat — the market’s risk price is real, but standard methods cannot reliably pin it down.
3. Macro factors only work at long horizons.
At the quarterly frequency, macroeconomic variables show almost no pricing power. But measured over a rolling 12-quarter window, cumulative GDP, industrial production, and consumption growth emerge as a robust and distinct pricing identity — one that survives even in a horse race against statistical factors. The implication: economic risk is priced, but it takes two to three years to fully reveal itself in asset prices.
4. The two leading intermediary factors are not the same.
The broker-dealer book-leverage factor (AEM) and the financial-intermediary capital-ratio factor (HKM) have been proposed as competing measures of financial intermediary health. The research finds they represent genuinely distinct identities: HKM behaves like a level factor while AEM captures a different, cross-sectionally active dimension of risk. This matters for risk management: hedging one does not hedge the other.
5. Characteristic-based factors are largely displaced by statistical factors.
When statistical (latent) factors are included in the competition, almost all characteristic-based factors — size, value, momentum, profitability — lose their distinct pricing identity. Their information is absorbed by the statistical factors. The exception is the macro identity, which survives even after controlling for the statistical factors. In other words, most smart-beta strategies are noisy proxies for something the data already captures more efficiently.
A Closer Look: Where Do Value, Size, and Momentum Fit?
Finding 5 raises a question worth focusing on, because the answer may surprise many factor investors: value, size, and momentum are all characteristic-based factors — and that puts them squarely in the category the paper finds is largely absorbed by statistical factors.
To understand why, it helps to be clear about the distinction between the two types.
Characteristic-Based vs. Statistical Factors
Characteristic-based factors are constructed by sorting stocks on observable firm attributes. Value factors rank stocks by book-to-market ratio, price-to-earnings, or similar metrics. Size sorts by market capitalization. Momentum sorts by past returns. The key feature is that a human researcher chose the characteristic first, based on theory or empirical observation, and then built a long-short portfolio around it.
Statistical (latent) factors are extracted mathematically from the return data itself, with no reference to any firm characteristic. Principal component analysis and risk-premia principal components (RP-PCs) identify the underlying dimensions along which returns move together. No economic story is attached to them in advance — they simply capture what is actually driving co-movement in prices.
What the Paper Finds
When the two types compete in a head-to-head horse race, the statistical factors win almost every round. Value, size, and momentum all lose their distinct pricing identities once a handful of latent statistical factors are included. Their pricing information is real — but it turns out the statistical factors capture it more cleanly, without the noise that comes from imperfect characteristic-based proxies.
The paper’s explanation is intuitive: any characteristic-sorted portfolio is a noisy measure of some underlying economic force. A stock’s book-to-market ratio, for example, is a reasonable proxy for its mix of assets in place versus growth options — but it is an imperfect one, contaminated by accounting differences, leverage, and other firm-specific noise. A statistical factor, by construction, filters out that noise and homes in on the priced component of returns directly.
This is not to say value, size, and momentum are useless. The paper acknowledges that the pricing variation they capture is genuine. The point is that latent factors measure the same underlying risk more precisely — which is why, in a direct competition, they subsume the characteristic-based factors rather than the other way around.
The Important Exception: Macro Factors
The one category that does not get absorbed is the macro identity. Long-horizon growth in GDP, industrial production, and nondurable consumption survives the horse race even after controlling for statistical factors. This suggests that macroeconomic fundamentals contain genuinely distinct pricing information that the data-driven statistical approach has not yet fully captured — which is itself a significant finding.
What This Means for Factor Investors
For investors who have built portfolios around value, size, and momentum tilts, this research is a useful calibration rather than a reason to abandon those tilts entirely. Three implications follow.
First, don’t confuse redundancy with irrelevance. The fact that statistical factors absorb characteristic-based ones means the underlying risks are priced — just that the characteristic is a noisy label for something the data captures more directly. A value tilt still earns a return for bearing the value-related risk; it just does so less efficiently than a latent-factor approach would.
Second, owning multiple characteristic-based factors provides less diversification than it looks. If value, investment, and quality strategies all map to one or two underlying identities — as the paper shows — then a portfolio combining all three is not as diversified as its factor count suggests. The apparent breadth is partly illusory.
Third, the macro identity is the genuinely underrepresented risk. Most smart-beta portfolios are built around characteristic-based factors, meaning they cluster around the identities that statistical factors already capture well. Long-horizon macroeconomic exposure — the one identity that survives the full horse race — is rarely the focus of standard factor ETFs. For investors seeking genuine diversification across distinct economic forces, this is the gap most worth addressing.
The results are hypothetical results and are NOT an indicator of future results and do NOT represent returns that any investor actually attained. Indexes are unmanaged and do not reflect management or trading fees, and one cannot invest directly in an index.
Key Takeaways for Investors and Advisors
The Bottom Line
You don’t need to track hundreds of factors. The evidence points to a small number of genuinely distinct economic forces — and most factor strategies are different labels for the same few underlying risks.
The factors that survive the identity test align closely with those Berkin and I identified in Your Complete Guide to Factor-Based Investing: market beta (but only as a level identity, not as a distinct cross-sectional slope factor); size; value (sharing an identity with the investment factor); profitability (based on ROE); and momentum (sharing an identity with performance-mispricing factors).
Factor Crowding Is Real and Measurable
When many ETFs and smart-beta strategies market themselves around different factors, they are frequently loaded on the same underlying economic risks. Diversifying across value, investment, and growth-option-based strategies provides less diversification than it appears because they share a common identity.
Long-Horizon Macro Exposure Matters
The research confirms that the economy’s long-run trajectory — not quarter-to-quarter GDP releases — is what equity investors are ultimately being compensated for. Strategies that position around short-term macro news may be measuring the wrong thing.
Be Skeptical of ‘New’ Factors
The paper provides advisors with a principled test: a proposed new factor adds genuine economic content only if it introduces a pricing identity not already spanned by existing ones. Most new factors in the literature fail this test. Before adding a new factor tilt to a portfolio, ask whether it truly represents a new source of risk or is just a rebranding of existing exposure.
Market Beta Still Matters
The market factor is economically important — it sets the overall level of risk premia — even if it doesn’t help explain which stocks do better than others.
True Diversification Means Spanning Different Identities
Genuine risk diversification comes from owning exposures across the macro identity, the latent statistical identity, and the market/level identity — not from mixing dozens of characteristic-based strategies that ultimately trace back to the same source.
A Practical Framework for Advisors: Mapping the Research to Real Portfolios
The research gives advisors a powerful diagnostic tool. Before asking “which factors should I own?”, first ask: which pricing identities am I already exposed to — and am I being compensated for genuine diversification or just paying fees for the same risk wearing different clothes?
Step 1 — Map Your Current Factor ETFs to Pricing Identities
The table below shows how the most widely used smart-beta and factor ETF categories map to the identities uncovered in the research. The key insight is that many strategies most advisors treat as distinct are in fact drawing from the same identity.
| ETF / Strategy Category | Common Examples | Pricing Identity | What This Means |
| Value (book-to-market) | IVE, VTV, VLUE, FF HML | Shared — investment | Draws from the same identity as investment and low-investment strategies. Owning both value and investment ETFs is largely redundant. |
| Investment / low-investment | FF CMA, q-factor IA | Shared — investment | Statistically indistinguishable from value in cross-sectional pricing. Cross-sectional loadings correlate ~95% with value despite only ~67% time-series correlation. |
| Quality / profitability | QUAL, DGRW, FF RMW | Partly latent / distinct | The ROE-based profitability factor (q-model) carries a genuinely distinct identity from RMW (robust-minus-weak). Construction details matter. |
| Momentum | MTUM, MOM, AQR Momentum | Latent / mispricing | Momentum clusters with performance-based mispricing factors. |
| Size (small cap) | IWM, SLYV, FF SMB, q ME | Shared — size | FF SMB and q-factor market equity (ME) are statistically the same identity. |
| Market / broad equity | SPY, VTI, IVV | Market / level | Captures the overall level of risk premia. Does not explain cross-sectional return differences but is irreplaceable for setting the baseline level of compensation. |
| Macro / economic cycle | Inflation-linked, commodity, cyclical sector tilts | Macro identity | The one category that survives even after controlling for statistical factors. Requires a 2–3 year measurement horizon to capture correctly. |
| Multi-factor (“all-in-one”) | LRGF, DFLV, Goldman ActiveBeta | Mixed — often redundant | Most multi-factor products combine value, investment, quality, and momentum — largely drawing from the same 1–2 identities. Genuine multi-identity diversification requires deliberate construction. |
Step 2 — Audit for Identity Overlap in Client Portfolios
A client holding a value ETF, a low-volatility ETF, an investment-quality ETF, and a multi-factor ETF may feel diversified across strategies. The research suggests they may be concentrated in one or two identities. Here is a simple diagnostic framework.
Audit Step 1: List all factor exposures
Identify every ETF or sleeve with a factor tilt. Pull the factor descriptions from fund documentation — not just the name.
Audit Step 2: Map to identities
Use the table above to assign each holding to a pricing identity. Flag any case where two or more holdings map to the same identity.
Audit Step 3: Check for macro exposure
The macro identity is the most underrepresented in standard smart-beta portfolios. Ask whether the portfolio has any deliberate long-horizon economic growth exposure.
Audit Step 4: Evaluate fee efficiency
If two holdings share an identity, the client is paying two fee structures for one risk exposure. One should typically be eliminated or consolidated.
Step 3 — Evaluate New Factor Products Before Adding Them
The research provides a principled test for any new factor strategy. Apply these questions before recommending a product to clients.
Does this factor have a genuine cross-sectional pricing identity?
Ask the fund provider: what is the cross-sectional correlation between this factor’s portfolio loadings and those of the Fama-French value and investment factors? If those correlations exceed roughly 80–90%, the factor is likely in the same identity cluster. A low time-series correlation between returns is not sufficient evidence of a distinct identity — the paper demonstrates this clearly with the value/investment example.
If it claims to be a macro factor, at what horizon is it measured?
The research shows that macro factors measured at a quarterly frequency carry almost no pricing information. Only macro variables measured over a cumulative 12-quarter (three-year) window emerge as a distinct pricing identity. Strategies claiming macro risk exposure based on short-horizon data sensitivity should be treated with skepticism.
Does the strategy survive after controlling for statistical (latent) factors?
This is the hardest question to answer from fund marketing materials, but the most important. The research found that characteristic-based factors are largely displaced by latent statistical factors. A strategy whose alpha disappears when controlling for principal-component risk is not offering a genuinely distinct source of return.
Is this an intermediary or financial-sector factor, and if so, which one?
The research found that the two leading intermediary factors — broker-dealer leverage (AEM) and capital ratio (HKM) — carry distinct identities with opposite cyclical implications. Any product claiming exposure to financial intermediary risk as a monolith should be pressed on which specific dimension it captures, since they behave differently across market cycles.
Important caveat: The research identifies what drives the cross-section of expected returns — it does not tell you how to time these exposures or guarantee any factor will be rewarded in a specific period. Identity-aware portfolio construction reduces redundancy and improves conceptual clarity; it does not eliminate risk or ensure outperformance.
The Bottom Line
True diversification — the kind that earns compensation for genuinely distinct economic exposures — requires intentional identity-level construction, not simply adding more factor labels.
Larry Swedroe is the author or co-author of 18 books on investing, including his latest Enrich Your Future. He is also a consultant to RIAs as an educator on investment strategies. This article is for informational and educational purposes only and should not be construed as specific investment, accounting, legal, or tax advice.
About the Author: Larry Swedroe
—
Important Disclosures
For informational and educational purposes only and should not be construed as specific investment, accounting, legal, or tax advice. Certain information is deemed to be reliable, but its accuracy and completeness cannot be guaranteed. Third party information may become outdated or otherwise superseded without notice. Neither the Securities and Exchange Commission (SEC) nor any other federal or state agency has approved, determined the accuracy, or confirmed the adequacy of this article.
The views and opinions expressed herein are those of the author and do not necessarily reflect the views of Alpha Architect, its affiliates or its employees. Our full disclosures are available here. Definitions of common statistics used in our analysis are available here (towards the bottom).
Join thousands of other readers and subscribe to our blog.