Can machine learning models help us exploit stock market anomalies more effectively? This paper says yes—but with a few important caveats. By applying gradient boosting algorithms to a wide array of established anomalies (like value, momentum, and quality), the authors show that machine learning methods can significantly improve the performance of long-short strategies. These models capture complex, nonlinear patterns and interactions that traditional linear models miss. The result? Higher Sharpe ratios and more robust performance across time and regions. But beware: not all complexity is useful, and careful model selection is key to avoiding overfitting and noise.
Enhancing Stock Market Anomalies with Machine Learning
- Azevedo and Hoegner
- Review of Quantitative Finance and Accounting , 2023
- A version of this paper can be found here
- Want to read our summaries of academic finance papers? Check out our Academic Research Insight category
Key Academic Insights
Machine Learning Boosts Predictive Power
Compared to traditional linear regressions, machine learning models (specifically gradient boosting) better exploit stock-level information to enhance anomaly returns.
Nonlinear Interactions Matter
ML models uncover complex relationships—such as how value and momentum interact under different market conditions—that linear models cannot detect.
Sharpe Ratios Improve Substantially
The enhanced strategies deliver significantly higher risk-adjusted returns, often doubling the Sharpe ratio of their traditional counterparts.
Cross-Region and Out-of-Sample Robustness
The findings hold across multiple international markets and persist even in stringent out-of-sample tests, suggesting true economic significance—not just data mining.
Practical Applications for Investment Advisors
Benchmark Active Strategies Against ML-Enhanced Models
ML models can serve as a modern benchmark for fund performance. If a fund manager claims to exploit anomalies, advisors can ask: does this strategy outperform a machine learning approach to the same data? This adds a layer of due diligence to manager selection. Please review other blogs we’ve written on the topic of machine learning and performance.
Design More Robust Custom Portfolios
With tools increasingly available to advisors (e.g., direct indexing or overlay platforms), it’s now possible to embed ML-derived factor weights into client portfolios—giving them access to institutional-level sophistication at retail cost.
Evaluate Fund Strategies with a Critical Eye
Not all “AI-driven” or “ML-powered” funds are created equal. Look under the hood—do they actually apply methods like boosting, or is it just marketing?
How to Explain This to Clients
“Imagine if your portfolio could not only see trends like value and momentum—but also understand how they work together in different market environments. That’s what machine learning helps us do. It’s not magic—it’s a smarter way to combine proven strategies by letting the data speak more clearly.”
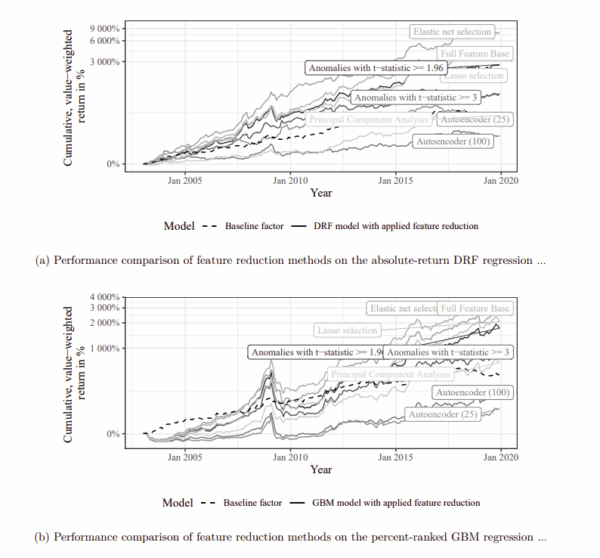
The Most Important Chart from the Paper
The graphs illustrate the cumulative performance of the four different machine learning algorithms in comparison to the Baseline factor during the post-2003 out-of-sample period.
Figure (a) shows the value-weighted return for the regression approach based on the stocks’
absolute next-month return, while Figure (b) refers to the approach based on percent-ranked
next-month returns.
The results are hypothetical results and are NOT an indicator of future results and do NOT represent returns that any investor actually attained. Indexes are unmanaged and do not reflect management or trading fees, and one cannot invest directly in an index.
Abstract
We examine the predictability of 299 capital market anomalies enhanced by 30 machine learning
approaches and over 250 models in a dataset with more than 500 million firm-month anomaly
observations. We find significant monthly (out-of-sample) returns of around 1.8-2.0%, and over
80% of the models yield returns equal to or larger than our linearly constructed baseline factor.
For the best performing models, the risk-adjusted returns are significant across alternative asset
pricing models, considering transaction costs with round-trip costs of up to 2% and including
only anomalies after publication. Our results indicate that non-linear models can reveal market
inefficiencies (mispricing) that are hard to conciliate with risk-based explanations.
About the Author: Elisabetta Basilico, PhD, CFA
—
Important Disclosures
For informational and educational purposes only and should not be construed as specific investment, accounting, legal, or tax advice. Certain information is deemed to be reliable, but its accuracy and completeness cannot be guaranteed. Third party information may become outdated or otherwise superseded without notice. Neither the Securities and Exchange Commission (SEC) nor any other federal or state agency has approved, determined the accuracy, or confirmed the adequacy of this article.
The views and opinions expressed herein are those of the author and do not necessarily reflect the views of Alpha Architect, its affiliates or its employees. Our full disclosures are available here. Definitions of common statistics used in our analysis are available here (towards the bottom).
Join thousands of other readers and subscribe to our blog.