Percent Accruals
- Nader Hafzalla, Russell Lundholm, and Matt Van Winkle
- A version of the paper can be found here.
Abstract:
We document how the effectiveness of an accruals-based trading strategy changes with the benchmark used to identify an extreme accrual. We measure “percent accruals” as accruals scaled by earnings, rather than total assets, and show that this seemingly small change produces a radically different sort of the data. We find that a trading strategy based on percent accruals yield significantly larger annual hedge returns than the traditional accruals measure, and does so mostly by improving the long position in low accrual stocks. The hedge returns are also significant in all but the lowest quintile of arbitrage risk. We show that percent accruals more effectively select firms where the difference between sophisticated and naïve forecasts are the most extreme. As such, our results are consistent with the earnings fixation hypothesis and are inconsistent with some alternative explanations for the accrual anomaly. We also find that percent accruals is not dependent on the presence or absence of special items and it identifies misvalued stocks just as well for loss firms as for gain firms, in contrast to the traditional accruals measure.
Data Sources:
Data are analyzed over the 1988-2008 time period. Data come from Compustat and CRSP.
Discussion:
The accrual anomaly is one of the oldest market efficiency puzzles out there (save the post earnings announcement drift, which has been documented since the early 60’s. I think Ray Ball started it, or that was the story I was told when I took his PhD accounting seminar in 2003 :-)). Regardless of who started it, Ray Ball is still the man.
What exactly is the accrual anomaly? I like to boil it down to a few words:
“Separating cash flow generators from storytellers.”
In the literature, accruals are often defined as net income less cash from operations, and are typically scaled by total assets so they are comparable across various assets. Starting with Sloan (1996), the literature has found that this very simple variable can create a very interesting long/short strategy (long low accrual, short high accrual) that produces fairly compelling returns.
Here is an interesting piece talking about the original strategy:
The economics behind why the accrual trading strategy works are varied depending on which author you speak to, however, here is a quick laundry list:
- Investors fixate on GAAP earnings numbers and ignore the information content of earnings components, e.g., accrued earnings vs cash earnings.
- Investors are unaware or ignore the statistical analysis that shows cash earnings are more persistent in predicting future earnings than are accrued earnings.
- Managers engage in earnings management via accruals and the market is to naive to detect the early warning signs.
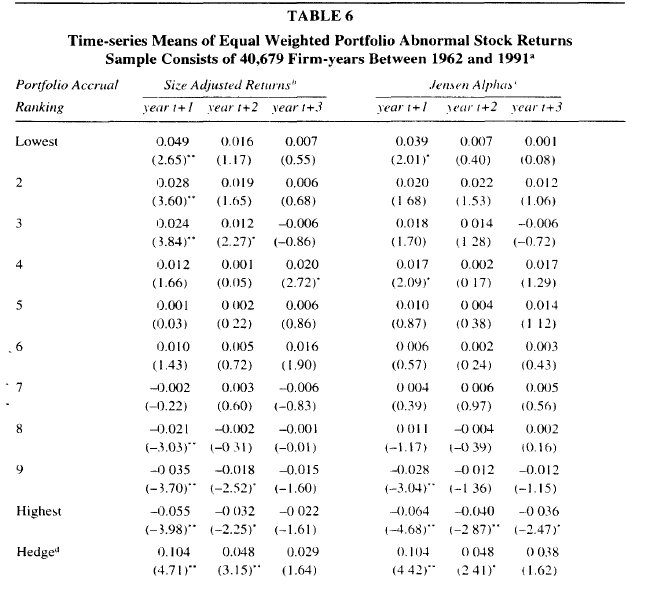
And here are the bottom line results from the original paper:

The results are hypothetical results and are NOT an indicator of future results and do NOT represent returns that any investor actually attained. Indexes are unmanaged, do not reflect management or trading fees, and one cannot invest directly in an index. Additional information regarding the construction of these results is available upon request.
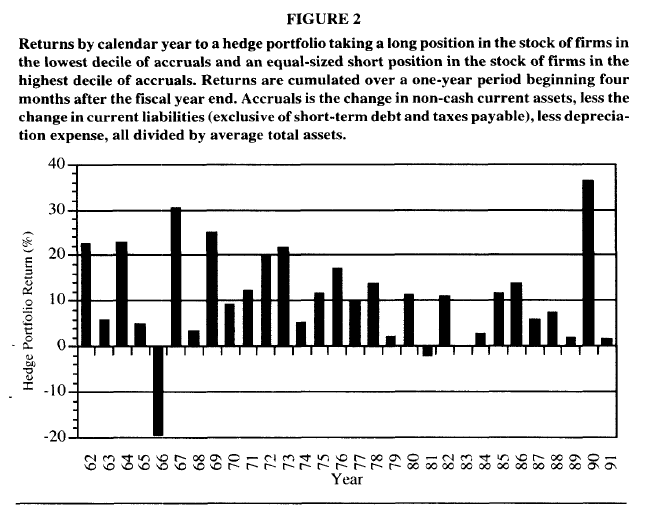
and for you finance porn lovers, here is the money shot…

The results are hypothetical results and are NOT an indicator of future results and do NOT represent returns that any investor actually attained. Indexes are unmanaged, do not reflect management or trading fees, and one cannot invest directly in an index. Additional information regarding the construction of these results is available upon request.
How does this paper improve upon the original accrual anomaly?
The primary difference between Sloan’s original piece and this paper is in how accruals are measured. This paper defines accruals as net earnings less cash from operations scaled by total earnings. The authors argue that scaling by total earnings, one can get a cleaner picture of the percentage of earnings that are represented by accruals, or, as the authors call it, “percent accruals.” I’ve drawn a simple breakdown of what the authors have done in the picture below (excuse the “ghetto-ness” of the drawing).

The results are hypothetical results and are NOT an indicator of future results and do NOT represent returns that any investor actually attained. Indexes are unmanaged, do not reflect management or trading fees, and one cannot invest directly in an index. Additional information regarding the construction of these results is available upon request.
How does this simple change in variable affect performance? See for yourself in the table below:

The results are hypothetical results and are NOT an indicator of future results and do NOT represent returns that any investor actually attained. Indexes are unmanaged, do not reflect management or trading fees, and one cannot invest directly in an index. Additional information regarding the construction of these results is available upon request.
One will immediately notice that the percent accrual measure is a lot more stable over time than the traditional accrual measure–and would have kept you from losing a lot of money in the mid 2000’s!
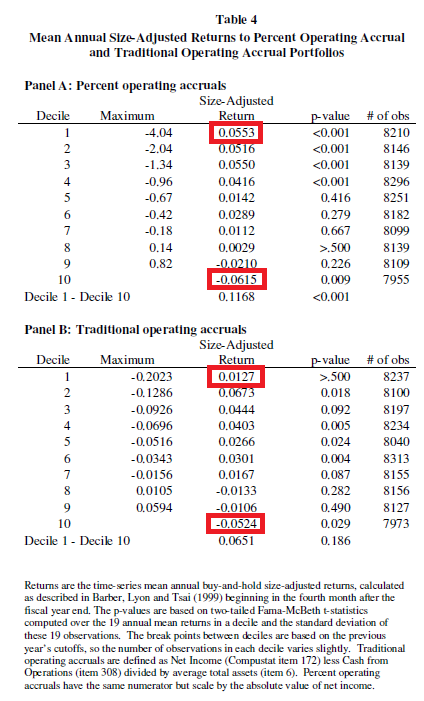
Below is a breakdown of the returns by decile. One thing I really like is the fact that the alpha for the long/short is fairly balanced between the long and the short book. In contrast, the traditional accrual measure derives most of the alpha from the short book–a warning sign that there probably isn’t much alpha to squeeze if one were to try and actually implement this strategy.

The results are hypothetical results and are NOT an indicator of future results and do NOT represent returns that any investor actually attained. Indexes are unmanaged, do not reflect management or trading fees, and one cannot invest directly in an index. Additional information regarding the construction of these results is available upon request.
Here is another interesting table from the paper that shows how one can dissect the strategy to create even higher returns.

The results are hypothetical results and are NOT an indicator of future results and do NOT represent returns that any investor actually attained. Indexes are unmanaged, do not reflect management or trading fees, and one cannot invest directly in an index. Additional information regarding the construction of these results is available upon request.
The key takeaway from this table is that one should apply the percent accrual strategy on a universe of stocks that have had negative earnings.
Investment Strategy:
- Calculate percent accruals for all firms in your universe
- Long low percent accrual firms
- Short high percent accrual firms
- Make money.
To juice it up:
- Change your universe to only firms that have lost money in the past year
- repeat 1, 2, 3, and 4 from above.
Commentary:
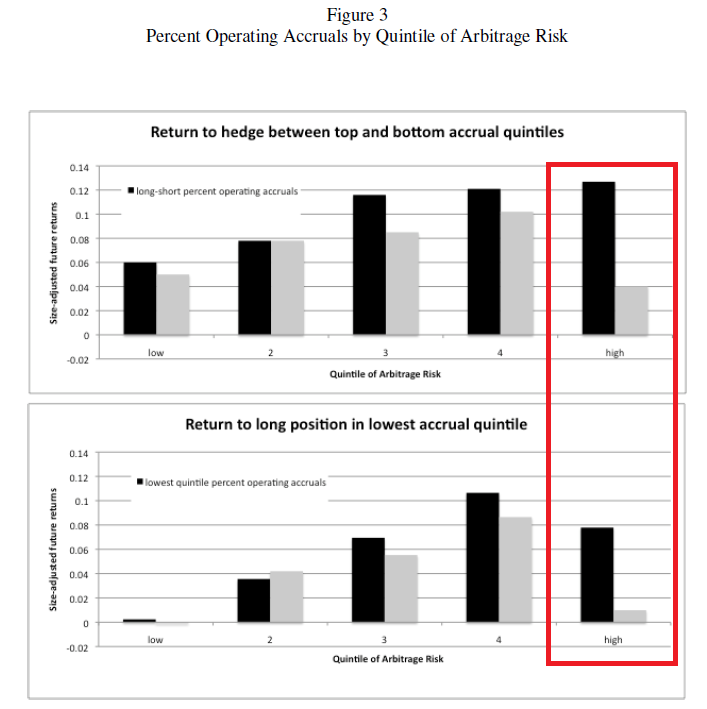
I’m interested in backtesting this strategy and exploring a variety of avenues related to this new measure for accruals. My guess is a lot of the alpha in accrual anomalies have been squeezed out ever since Sloan bailed from academia and went to work for industry. In fact, since Sloan’s paper was released (~1996), the original anomaly has not worked that well. Another interesting tidbit regarding the strategy is the ability to implement the strategy in the face of arbitrage risks, which are measured by the idiosyncratic volatility of stocks (translation: stocks that move all over the damn place, regardless of market movements). From the chart below, one can see that a lot of the alpha is concentrated in the higher arbitrage risk portfolios.

The results are hypothetical results and are NOT an indicator of future results and do NOT represent returns that any investor actually attained. Indexes are unmanaged, do not reflect management or trading fees, and one cannot invest directly in an index. Additional information regarding the construction of these results is available upon request.
Note, Nader Hafzalla, a co-author on this paper, died while working on this research as a PhD student at the University of Michigan. Hopefully, this blog post will help share the wonderful research Nader did while he was alive.
About the Author: Wesley Gray, PhD
—
Important Disclosures
For informational and educational purposes only and should not be construed as specific investment, accounting, legal, or tax advice. Certain information is deemed to be reliable, but its accuracy and completeness cannot be guaranteed. Third party information may become outdated or otherwise superseded without notice. Neither the Securities and Exchange Commission (SEC) nor any other federal or state agency has approved, determined the accuracy, or confirmed the adequacy of this article.
The views and opinions expressed herein are those of the author and do not necessarily reflect the views of Alpha Architect, its affiliates or its employees. Our full disclosures are available here. Definitions of common statistics used in our analysis are available here (towards the bottom).
Join thousands of other readers and subscribe to our blog.
