Suppose you had to sail across the Atlantic and were given a choice between making the crossing in either an 8 foot sailing dinghy, or a 60 foot yacht. Which would you choose? Obviously, you would want the safety and security afforded by the larger and more durable and seaworthy yacht. The same concept holds when deciding upon the stocks to include in your portfolio: all else equal, an investor should seek out those financially strong stocks that are less vulnerable to downturns in the business cycle or other macroeconomic shocks.
Welcome to Part 3b of our four part overview of optimizing a systematic value investing approach – how to identify low risk, high quality, undervalued stocks that generate market beating returns. In Part 1, we discussed how to avoid permanent capital impairment; in Part 2, we covered how to measure whether a stock is cheap; Part 3 involves two distinct elements of “quality,” with Part 3a covering the first, how to identify an economic moat, or franchise, and today’s Part 3b, how to measure financial strength, the second component to our quality assessment.
We know intuitively why a durable 60 foot yacht protects sailors better than a fragile dinghy: its heavy keel keeps it stable, it won’t roll violently in heavy winds, and it can take a pounding by waves. What are the financial characteristics that enable a firm to protect capital during a stormy business climate or from unanticipated adverse developments in the business? About 10 years ago, Joseph Piotroski, a specialist in accounting-based fundamental analysis, and currently a professor at Stanford, had some clever ideas on this subject.
Piotroski started with the cheapest stocks (lowest price/book), but reasoned that he could do better than a simple value-based quantitative approach by further refining his universe to eliminate those firms that were likely to under perform the market, based on their weak financial strength. He used a nine-point scale to evaluate the financial strength of companies and eliminated those most at risk of financial distress. He created a scale, which he called the “F_SCORE,” on financial statement metrics across several areas: profitability, leverage, liquidity and source of funds, and operating efficiency. The results were nothing short of astonishing, he found that an investment strategy that bought expected winners and shorted expected losers from the lowest price/book bucket, generated a 23 percent annual return between 1976 and 1996–Buffett would be proud of that record!

The results are hypothetical results and are NOT an indicator of future results and do NOT represent returns that any investor actually attained. Indexes are unmanaged, do not reflect management or trading fees, and one cannot invest directly in an index. Additional information regarding the construction of these results is available upon request.
If I have seen further, it is by standing on the shoulders of giants.
– Isaac Newton
Here at Turnkey Analyst we believe in standing on the shoulders of giants whenever possible since, as Newton points out, you can see so much farther. We therefore use Piotroski’s F-SCORE as a basis for our approach to measuring financial strength, but we refine several variables in some subtle ways we think are slightly more intuitive. Rather than dive into the minutiae of how our approach differs specifically from Piotroski’s, we will simply lay out our metrics, which we refer to as the financial strength score, or “FS_Score,” and discuss how we measure aspects of financial strength.
As a reminder, at this stage of the quantitative value process we’ll be focused on quality:
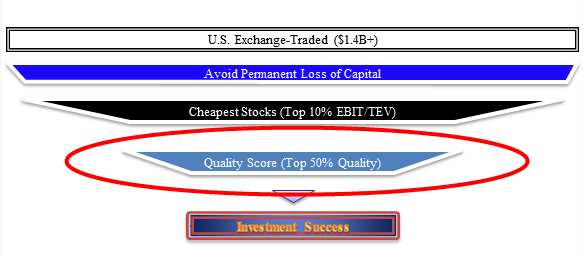
And here is an outline of our approach to identifying quality. As previously mentioned, in a previous post we focused on Franchise Power and in this post we cover Financial Strength.
- Franchise Power
- High Returns
- Margin strength and stability
- Financial Strength (what we are about to cover)
Financial Strength
Current Profitability
Our first financial strength category is profitability, which we measure using three signals. For each of our three profitability signals, we run a test, and award a one if the firm passes the test (which is good), and award a zero if the firm fails the test (which is bad).
- ROA is Return on Assets (net income before extraordinary items / most recent total assets); if ROA is positive, we award a one, otherwise a zero
- FCFTA is free cash flow / most recent total assets; if FCFTA is positive, award a one, otherwise a zero (note that free cash flow is operating cash flow – capital expenditures)
- ACCRUAL is net income before extraordinary items – cash flow from operations, scaled by beginning of the year total assets; if cash flow from operations > net income before extraordinary items, award a one, otherwise a zero. For a quick overview of accruals and how they measure earnings quality see this earlier post: https://alphaarchitect.com/2011/09/the-accrual-anomaly-for-dummies/
Stability
Our stability measures involve the concepts of leverage, liquidity and equity dilution. If there are negative trends in these areas, we take that to mean the company has become less financially stable overall. As with profitability, we look at each signal, awarding a one if desired conditions are met, or a zero otherwise. (Also note that the “Δ” symbol below, or delta, is simply a mathematical convention denoting change of a quantity)
- ΔLEVER is the change in the ratio of long-term debt to total assets. If ΔLEVER<0, and the firm’s leverage ratio is declining, we award a one, or a zero otherwise
- ΔLIQUID is the change in the current ratio, which is current assets / current liabilities, and measures a firm’s ability to meet its short-term obligations; if ΔLIQUID>0 and the current ratio is increasing, we award a one, or a zero otherwise
- NEQISS is net equity issuance, or stock repurchases – issuances; in general, if a firm is a net issuer of equity, it is statistically likely to be diluting shareholder value; if NEQISS>0, and repurchases exceed issuances, we award a one, or a zero otherwise
These three metrics capture important elements of a firm’s financial stability by measuring changes in leverage and liquidity, as well as dilution trends. We look for positive trends across these metrics, including reduced leverage, increasing liquidity, and anti-dilution.
Recent Operational Improvements
The operational improvements measurements reflect underlying efficiency trends in the business. We hope that such desirable efficiency changes in a firm’s operations may not be fully reflected in the stock price. We can also use these to guard against buying a business with deteriorating fundamentals.
- ΔROA is the current year’s ROA – the prior year’s ROA; it measures whether ROA is increasing; if ΔROA>0 and therefore profits scaled by assets are increasing, we award a one, or a zero otherwise
- ΔFCFTA is the current year’s FCFTA – the prior year’s FCFTA; it measures whether free cash flow, scaled by assets, is increasing; if ΔFCFTA>0 and free cash flow scaled by assets is increasing, we award a point, or a zero otherwise
- ΔMARGIN is the current year’s gross margin ratio – the prior year’s gross margin ratio, where the gross margin ratio is gross margin / sales; this measures the change in efficiency a firm’s management of cost inputs such as overhead, materials and labor in the production process; if ΔMARGIN>0 and margins are increasing, we award a one, or a zero otherwise
- ΔTURN is the current year’s asset turnover ratio – the prior year’s asset turnover ratio, where the asset turnover ratio is total sales / beginning of the year total assets; this measures the efficiency of a company in using its assets to generate sales; ΔTURN>0 and efficiency is increasing, we award a 1, or a zero otherwise
Measurement of these various operational improvements can capture strengths and weaknesses in the business, and can provide an integrated picture of overall operating performance. If poor underlying trends remain in place, the business can deteriorate, leaving the investor with a less valuable asset.
Tying it all together
We have identified 10 separate signals across our three categories of financial strength: profitability, stability, and recent operating improvements. Our final FS_SCORE is therefore on a scale from one to 10, and is computed as follows:
FS_SCORE = Sum(FS_ROA, FS_FCFTA, FS_ACCRUAL, FS_LEVER, FS_LIQUID, FS_NEQISS, FS_ΔROA, FS_ΔFCFTA, FS_ΔMARGIN, FS_ΔTURN)
The FS_SCORE reduces the overall financial health of a firm to a single number, which can be used as a basis for comparing a firm’s overall financial strength versus that for other firms. A human analyst might use FS_SCORE to identify specific areas within operations and the financial statements for further review and analysis. For our purposes, we combine a firm’s FS_SCORE with its franchise or economic moat score to arrive at an overall “quality” score that we use in evaluating a firm in combination with our other factors to find the best stocks to invest in. As expected, using enhanced measures of quality to identify winners and losers among cheap stocks, has historically been an appealing investment strategy.
In our final Part 4 post, we will bring together all the different parts of our systematic value investing approach: eliminating stocks that risk causing permanent capital impairment, screening for the cheapest stocks, and identifying the highest quality stocks within our cheap universe. We hope you enjoy this journey to find the holy grail of systematic value investing!
About the Author: David Foulke
—
Important Disclosures
For informational and educational purposes only and should not be construed as specific investment, accounting, legal, or tax advice. Certain information is deemed to be reliable, but its accuracy and completeness cannot be guaranteed. Third party information may become outdated or otherwise superseded without notice. Neither the Securities and Exchange Commission (SEC) nor any other federal or state agency has approved, determined the accuracy, or confirmed the adequacy of this article.
The views and opinions expressed herein are those of the author and do not necessarily reflect the views of Alpha Architect, its affiliates or its employees. Our full disclosures are available here. Definitions of common statistics used in our analysis are available here (towards the bottom).
Join thousands of other readers and subscribe to our blog.