Two weeks ago, we posted a simulation study on the performance of cheap and expensive stocks based on various valuation metrics. The dart-throwing monkeys simulations gave us a vivid look of how cheap stocks beats expensive stocks regarding compound annual growth rates (CAGR), standard deviation, and maximum drawdown.
Here is the link to the older post: Never buy expensive stock. Period.
We received over 50 emails asking that we do the same analysis, but on “momentum.”
A PDF version of this is available here.
You Asked; We Listened…
The most basic momentum strategy buys stocks that have performed well in the past. This strategy is very different from a pure value strategy, which exclusively focuses on buying cheap stocks.
CXOAdvisory, GestaltU, Gary Antonnaci, and Millennial Invest — as well as others — have discussed different angles on momentum. And of course, there is a slew of academic research on the topic.
How Does Our Simulation Work?
For testing purposes, we create 2 samples. The first sample is from 1927 to 1962 and the second sample is from 1963 to 2013. The samples are selected in a way that we can compare the results of the momentum simulations to the value simulations, which run from 1963 to 2013.
We sort stocks into deciles based on stock performance over the previous 12-month ranking-period returns (months t-12 through t-2, skipping the first month).
We only focus on US mid/large cap to avoid weird micro/small cap outlier effects.
- Example: If there are 1000 stocks in the universe, stocks 1-100 go in the first decile (High mom/winners), stocks 901-1000 go in the tenth decile (Low mom/losers), and the stocks in between 101 and 900 go in their respective deciles.
Next, each month we draw a random 30 stock portfolio drawn from either the “winners” decile or the “losers” decile.
- Example: We draw 30 random stocks each month from the top (winners) and bottom (losers) decile from 1927 to 1962. Again, image we have a monkey throwing 30 darts, every month during the 36 year period, to establish, in each month, a new 30 stock portfolio. Once our monkey has thrown his 30 darts in each month, we will then have 432 separate monthly portfolios (12 months * 36 years) and will have made 12,960 (30 stocks * 432 months) individual stock picks. This represents one simulation.
We conduct 1000 simulations for the top (winners) decile and 1000 simulations for the lowest (losers) decile as described above.
We then calculate the performance statistics for each simulated strategy over the designated time period (e.g. 1927 to 1962).
Each simulated strategy represents the returns a high-mom-investing monkey (past-winner buyer) or low-mom-investing monkey (past-losers buyer) would achieve over the sample time period analyzed. We calculate compound annual growth rates (CAGR), standard deviation, and maximum drawdown.
We compile the results in the charts/tables below.
What Do the Returns to Winners and Losers Look Like?
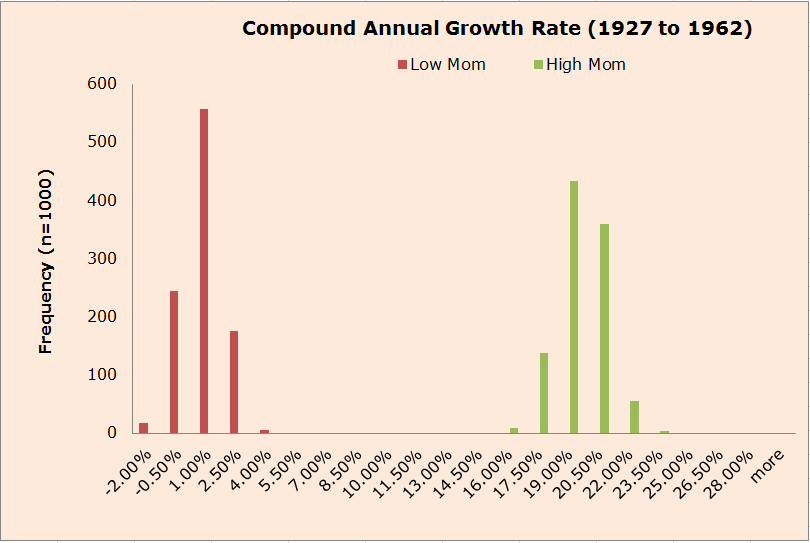
First, let’s look at the distribution of CAGRs. The high mom portfolios generate much higher returns than the low mom, almost 20% higher on average. Clearly, buying winner stocks has generated strong performance and buying losers has been a sucker’s bet.
The results are hypothetical results and are NOT an indicator of future results and do NOT represent returns that any investor actually attained. Indexes are unmanaged, do not reflect management or trading fees, and one cannot invest directly in an index. Additional information regarding the construction of these results is available upon request.
Historically, high mom beats low mom on a CAGR basis–no doubt.How about the Risks?
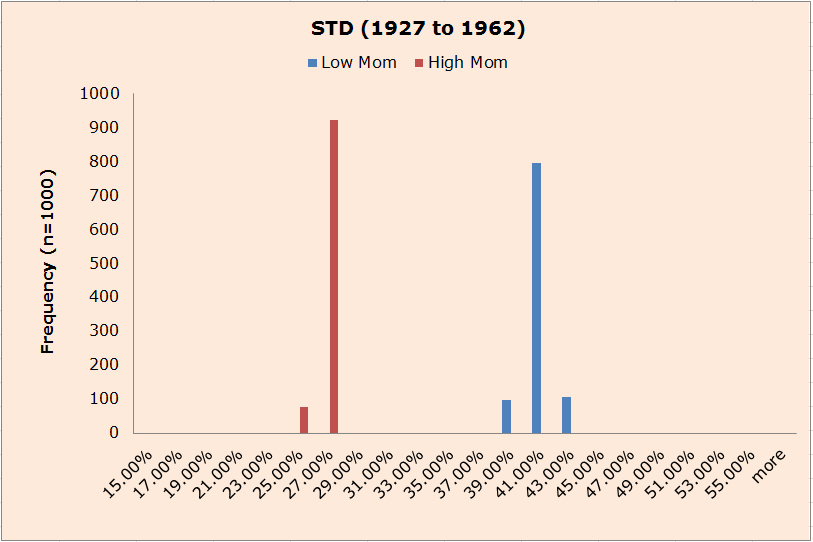
Let’s look at standard deviations of the portfolios from our dart-throwing monkeys. First, you’ll notice that standard deviations are tightly bound, even across 1000 simulations.
No matter how you cut it, holding baskets of high mom stocks means less volatility. Low momentum stocks exhibit incredible volatility.
The results are hypothetical results and are NOT an indicator of future results and do NOT represent returns that any investor actually attained. Indexes are unmanaged, do not reflect management or trading fees, and one cannot invest directly in an index. Additional information regarding the construction of these results is available upon request.
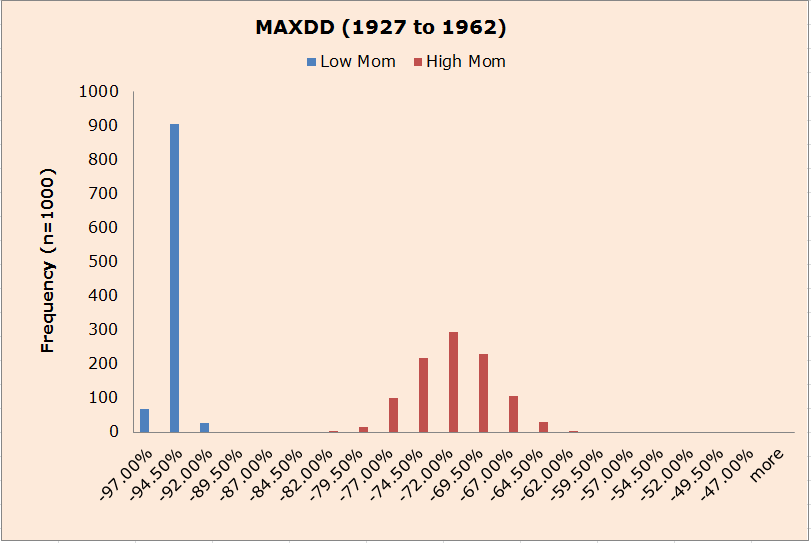
Momentum strategies are known to crash and burn. This is best captured via drawdowns. The evidence below suggests that high mom stocks protect the downside better than low mom stocks, but let’s be honest–investing in momentum is a wild ride!
The results are hypothetical results and are NOT an indicator of future results and do NOT represent returns that any investor actually attained. Indexes are unmanaged, do not reflect management or trading fees, and one cannot invest directly in an index. Additional information regarding the construction of these results is available upon request.
What are the Results over a Different Time Period?
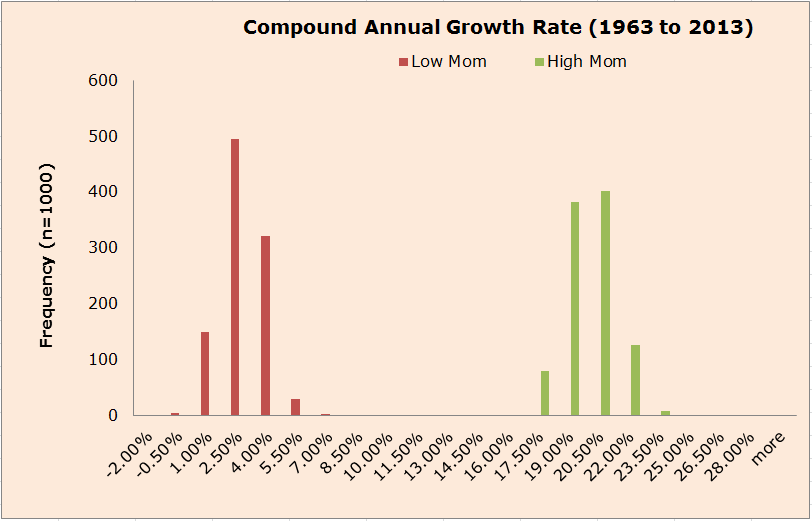
From the 1927 to 1962 (36 years) period we get a clear picture that past winners keep winning and past losers keep losing. We conduct the same simulation analysis from 1963 to 2013 (50 years).
The results are broadly consistent, but volatility and drawdowns have closed in on one another.
Similar CAGR distributions: High mom stocks are the obvious winners.
The results are hypothetical results and are NOT an indicator of future results and do NOT represent returns that any investor actually attained. Indexes are unmanaged, do not reflect management or trading fees, and one cannot invest directly in an index. Additional information regarding the construction of these results is available upon request.
High mom still has relatively lower Standard deviation, but volatility has converged.

The results are hypothetical results and are NOT an indicator of future results and do NOT represent returns that any investor actually attained. Indexes are unmanaged, do not reflect management or trading fees, and one cannot invest directly in an index. Additional information regarding the construction of these results is available upon request.
High mom stocks still protect the downside better than low mom stocks, but the drawdowns are more similar than in the prior period. There is also a clear message that investing based on momentum doesn’t prevent your stomach from churning–momentum equity investing is RISKY!
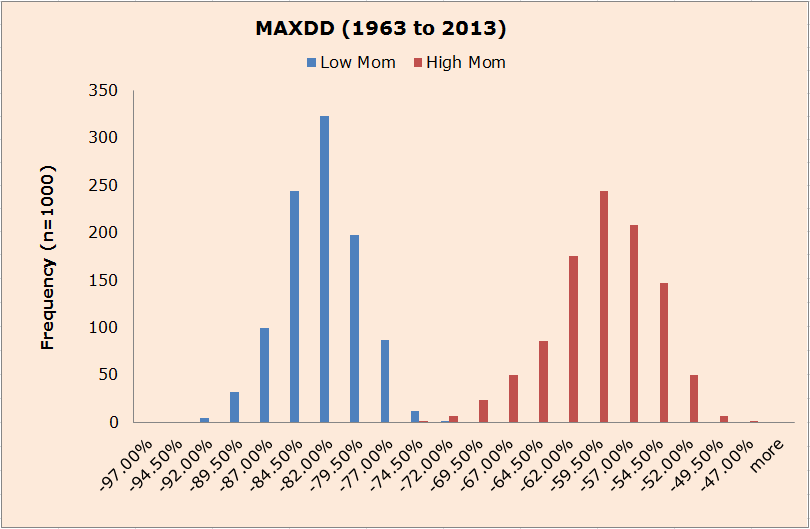
The results are hypothetical results and are NOT an indicator of future results and do NOT represent returns that any investor actually attained. Indexes are unmanaged, do not reflect management or trading fees, and one cannot invest directly in an index. Additional information regarding the construction of these results is available upon request.
Conclusions
Momentum has historically been a great strategy. Although counter-intuitive to many value investors, buying stocks with rising prices has been a great investment approach–arguably better than value investing.
Moreover, the approach is robust between the 2 samples analyzed. The lesson is clear: Let your winners ride and cut your losers short.
If you’d like to compare the momentum results to the value results, here is a link to the value post: Never buy expensive stock. Period.
About the Author: Wesley Gray, PhD
—
Important Disclosures
For informational and educational purposes only and should not be construed as specific investment, accounting, legal, or tax advice. Certain information is deemed to be reliable, but its accuracy and completeness cannot be guaranteed. Third party information may become outdated or otherwise superseded without notice. Neither the Securities and Exchange Commission (SEC) nor any other federal or state agency has approved, determined the accuracy, or confirmed the adequacy of this article.
The views and opinions expressed herein are those of the author and do not necessarily reflect the views of Alpha Architect, its affiliates or its employees. Our full disclosures are available here. Definitions of common statistics used in our analysis are available here (towards the bottom).
Join thousands of other readers and subscribe to our blog.