In general, investors focused on affordable stocks with strong fundamentals have been taken to the cleaners year-to-date.
Meanwhile, expensive stocks with poor fundamentals have been rocking!
Some Basic Statistics:
Below we document some core performance figures using Ken French’s data on value/growth portfolios (proxy for cheap/expensive) and high profitability/low profitability portfolios (proxy for high quality/low quality).
We look at the value-weight returns for the top and bottom decile portfolios. The monthly returns runs from 1/1/2015 to 6/30/2015. Results are gross of fees. All returns are total returns and include the reinvestment of distributions (e.g., dividends).
Specifically, here are the four portfolios:
- Expensive = Value-weight returns to the bottom decile formed on B/M.
- Cheap = Value-weight returns to the top decile formed on B/M.
- Low Quality = Value-weight returns to the bottom decile formed on profitability.
- High Quality = Value-weight returns to the top decile formed on profitability.
Here are the month-by-month results–a nasty year for cheap value stocks (as proxied by B/M) and high quality stocks (as proxied by profitability):
| Month | Expensive | Cheap | Outcome | Low Quality | High Quality | Outcome |
| 201501 | 0.04% | -6.87% | Lose | -1.68% | -2.17% | Lose |
| 201502 | 6.71% | 3.56% | Lose | 9.64% | 6.55% | Lose |
| 201503 | -0.69% | -1.59% | Lose | -0.31% | -0.66% | Lose |
| 201504 | 0.19% | 1.81% | Win | -0.53% | 0.80% | Win |
| 201505 | 2.17% | 0.58% | Lose | 5.18% | 0.78% | Lose |
| 201506 | 0.61% | -0.71% | Lose | -1.38% | -1.24% | Win |
The results are hypothetical results and are NOT an indicator of future results and do NOT represent returns that any investor actually attained. Indexes are unmanaged, do not reflect management or trading fees, and one cannot invest directly in an index. Additional information regarding the construction of these results is available upon request.
How have Expensive Low-Quality Stocks Performed Relative to Cheap High-Quality Stocks?
In this section we look at the YTD performance of expensive low-quality stocks versus cheap high-quality stocks.
We examine value-weight returns for cheap high-quality quintile and the expensive low-quality quintile. The daily returns run from 1/1/2015 to 6/30/2015. Results are gross of fees. All returns are total returns and include the reinvestment of distributions (e.g., dividends).
Specifically, here are the two portfolios:
- Cheap, High Quality = Value-weight returns to the cheap high-quality quintile.
- Expensive, Low Quality = Value-weight returns to the expensive low-quality quintile.

The results are hypothetical results and are NOT an indicator of future results and do NOT represent returns that any investor actually attained. Indexes are unmanaged, do not reflect management or trading fees, and one cannot invest directly in an index. Additional information regarding the construction of these results is available upon request
Year-to-date, a portfolio of cheap high-quality socks is down around 6%, before fees and expenses (probably more like -7% if those were included).
In contrast, a portfolio of the most expensive, lowest-quality firms is up around 12%, before fees and expenses (probably around 11% after fees).
On net, the spread is almost 18% YTD.
Incredible, but not surprising.
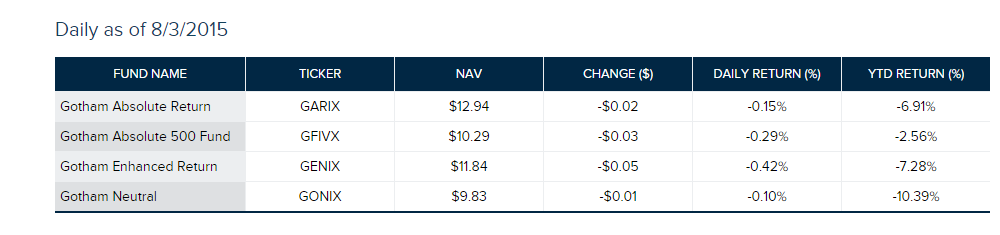
When we look to the marketplace for live strategies focused on market neutral strategies anchored on cheapness and quality, the Gotham Funds Gotham Neutral fund is probably the most prominent example. The fund isn’t completely market neutral, but at a 25% net long exposure, that is about as close as we’re gonna get.
YTD the Gotham Neutral Fund is down 10.39%. That is pretty terrible, and it would have been worse if they were truly market neutral, but in the context of the results above, where one goes long generic value/quality and short generic expensive/junk, -10%+ isn’t half bad. One could argue on a factor-basis that they added value (I know, that sounds odd).
As we’ve said time and time again, active value investing has been digging manager graveyards since 1900…but that is the nature of the active value investing game…long horizons are required and volatility relative to the standard benchmarks can be expected.
About the Author: Wesley Gray, PhD
—
Important Disclosures
For informational and educational purposes only and should not be construed as specific investment, accounting, legal, or tax advice. Certain information is deemed to be reliable, but its accuracy and completeness cannot be guaranteed. Third party information may become outdated or otherwise superseded without notice. Neither the Securities and Exchange Commission (SEC) nor any other federal or state agency has approved, determined the accuracy, or confirmed the adequacy of this article.
The views and opinions expressed herein are those of the author and do not necessarily reflect the views of Alpha Architect, its affiliates or its employees. Our full disclosures are available here. Definitions of common statistics used in our analysis are available here (towards the bottom).
Join thousands of other readers and subscribe to our blog.