Jack and I published, “Analyzing Valuation Measures: A Performance Horse-Race Over the Past 40 Years,” in the 2012 Journal of Portfolio Management.

Here is a summary of the research paper on our own blog.
The paper asked a simple question: “Which valuation metric has historically performed the best?”
Here were the participants in this horse-race:
- Earnings to Market Capitalization (E/M).
- EBITDA to Total Enterprise Value (EBITDA/TEV).
- Free Cash Flow to Total Enterprise Value (FCF/TEV).
- Gross-Profits to Total Enterprise Value (GP/TEV).
- Book Value of Equity to Market Capitalization (B/M)
Below are the summary results from the paper (July 1971 through December 2010). Note that these results include a range of companies from the largest to even very small companies, which may be uninvestable:
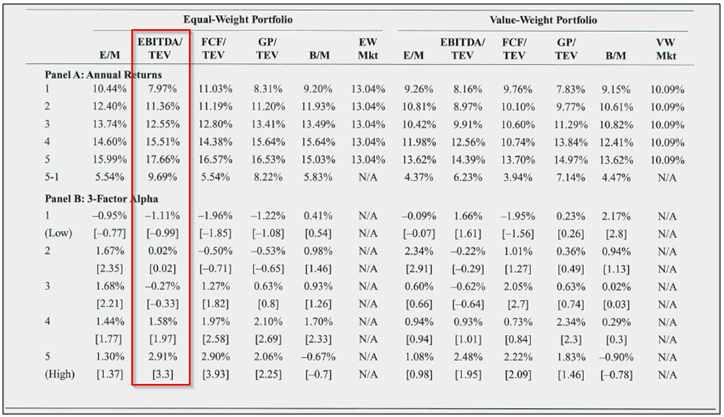
The results are hypothetical results and are NOT an indicator of future results and do NOT represent returns that any investor actually attained. Indexes are unmanaged, do not reflect management or trading fees, and one cannot invest directly in an index. Additional information regarding the construction of these results is available upon request.
Here are the same results, but looking at only mid and large cap companies, which are investable. We also expand the sample from January 1964 to December 2010.
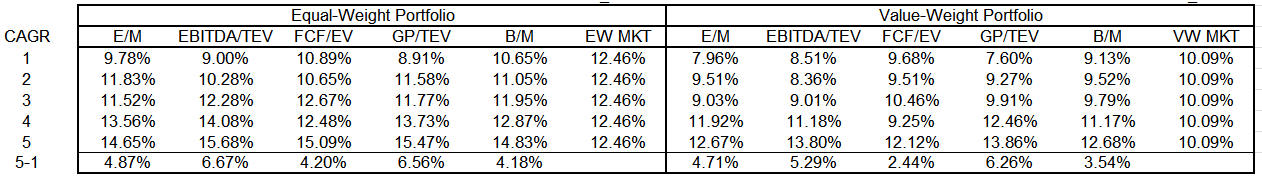
The results are hypothetical results and are NOT an indicator of future results and do NOT represent returns that any investor actually attained. Indexes are unmanaged, do not reflect management or trading fees, and one cannot invest directly in an index. Additional information regarding the construction of these results is available upon request.
Value investing has worked, regardless of how one identifies “cheap.” Enterprise values beat the competition after running the various metrics through a variety of robustness tests (results not published in the original paper confirm this finding.) Gross profits to TEV also does quite well, but it is also highly related to enterprise multiples. The only real difference between EBITDA and gross profits is operating expenses. Results for EBIT/TEV aren’t included to stay in line with the original paper, but the EBIT figure only differs from EBITDA by subtracting a GAAP estimate of “capex” requirements in the form of depreciation and amortization expenses.
And we aren’t the only ones to identify this performance phenomenon related to enterprise multiples. Other researchers have found the same thing in domestic and international markets. We expand on this concept in our book, Quantitative Value (summarized here). In short, enterprise multiples are pretty decent when it comes to sorting stocks on “cheapness.” We have done extensive internal research on understanding “why” this is the case and we will share these findings in the coming months.
Nonetheless, now that some time has passed since our 2012 publication, we can assess the horse race results over the past 5 years. Here are the updated results from January 1 2011 through December 31, 2015. Results are gross of transaction costs and management fees. All returns are total returns and include the reinvestment of distributions (e.g., dividends). The empirical test specifics are similar to the original paper.
Here are the results on the mid/large cap universe:
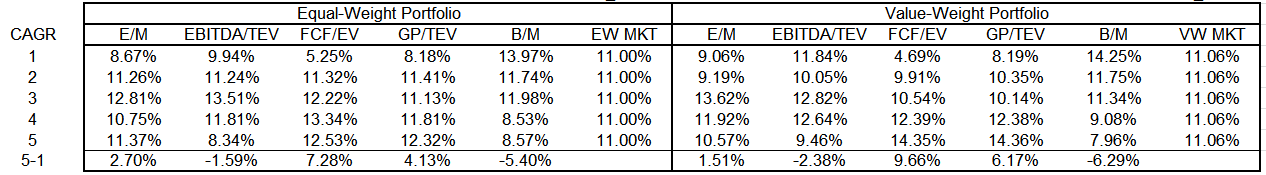
The results are hypothetical results and are NOT an indicator of future results and do NOT represent returns that any investor actually attained. Indexes are unmanaged, do not reflect management or trading fees, and one cannot invest directly in an index. Additional information regarding the construction of these results is available upon request.
Yuck. Value as a whole didn’t work that well based on compound annual growth rates (shown above. Sharpe ratios have similar takeaways).
Here are the metric summaries:
- B/M REALLY stunk.
- Enterprise multiples stunk (although variations such as EBIT/TEV were a bit better).
- E/M (which represents P/E) were lame.
- Gross profits / TEV results were pretty solid.
- FCF/EV was great!
- Note: the results for some metrics are especially bad due to the last half of 2015
Really tough to assess much of anything over a 5 year window — especially on portfolio spreads — but a good learning point. Just because something works, on average and over a long period of time, doesn’t mean it will work all the time. This rule applies on two-levels: value as a whole, and the enterprise value in particular. On net, value hasn’t shined the past 5 years. Also, enterprise multiples, the historical horse-race victor, came in dead last.
Stepping back, the results over the full data sample (1/1/1964 to 12/31/2015) still support the broader conclusion that we should “buy cheap” — regardless of the metric chosen. And enterprise values — along with their close brother the GP/TEV ratio — seem to be the most effective valuation metrics, historically.
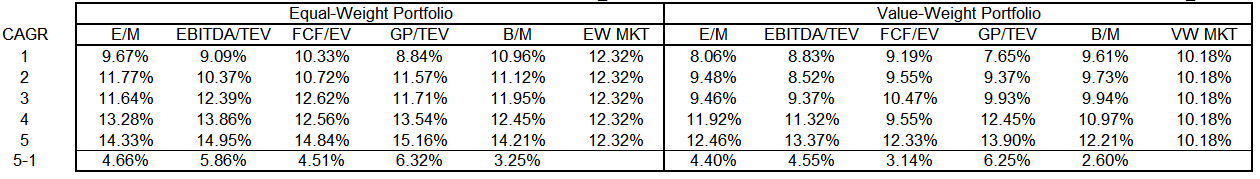
The results are hypothetical results and are NOT an indicator of future results and do NOT represent returns that any investor actually attained. Indexes are unmanaged, do not reflect management or trading fees, and one cannot invest directly in an index. Additional information regarding the construction of these results is available upon request.
But there is an interesting puzzle here. For things to work over the long-haul, they can’t work all the time, or everyone “arbitrages” the easy money opportunity. So in a sick twisted way, believers in value, and the enterprise value metric in particular, can be comforted by the recent poor performance. This poor performance is laying the ground work for sustainable expected performance over the long-haul.
That’s the theory, at least :-)
Note: Thanks to the illustrious Yang Xu for putting these numbers together!
About the Author: Wesley Gray, PhD
—
Important Disclosures
For informational and educational purposes only and should not be construed as specific investment, accounting, legal, or tax advice. Certain information is deemed to be reliable, but its accuracy and completeness cannot be guaranteed. Third party information may become outdated or otherwise superseded without notice. Neither the Securities and Exchange Commission (SEC) nor any other federal or state agency has approved, determined the accuracy, or confirmed the adequacy of this article.
The views and opinions expressed herein are those of the author and do not necessarily reflect the views of Alpha Architect, its affiliates or its employees. Our full disclosures are available here. Definitions of common statistics used in our analysis are available here (towards the bottom).
Join thousands of other readers and subscribe to our blog.