Benjamin Graham, who first established the idea of purchasing stocks at a discount to their intrinsic value nearly a century ago, is known today as the father of value investing. Since Graham’s time, academic research has shown that low price to fundamentals stocks have historically outperformed the market. In the investing world, Graham’s most famous student, Warren Buffett, has inspired legions of investors to adopt the value philosophy. Despite widespread knowledge that value investing generates higher returns over the long haul, value-based strategies are often ridiculed for “not working” and being too old-fashioned. The critics of value investing bring up a reasonable point: Why would quantitative value investing work in the first place?
The answer relates to several fundamental truths in which we believe:
- Higher returns generally come with higher risks
- Human beings are not always hyper-rational, which means prices aren’t always perfect
The first point should be obvious, and the second point stems from the reality that our evolution has optimized our ability to survive in the jungle with our tribes, not maximize our ability to identify the portfolio that will deliver the best-expected Sharpe ratio on our 401k portfolio over a 40-year horizon. And while we will never eliminate our bad behaviors, we believe one can minimize their impact by employing quantitative tools.
Quantitative Value Investing
“Quantitative,” is often considered to be an opaque mathematical black art, only practiced by Ivory Tower academics and supercomputers. Nothing could be further from the truth. Systematic processes are tools that value investors can use to minimize their “biases” when investing.
Quantitative value investing tools serve two purposes:
- Protect us from our own behavioral errors
- Exploit the behavioral errors of others.
These tools do not need to be complex, but they do need to be systematic. The research overwhelmingly demonstrates that simple, systematic processes outperform human “experts.” The inability of human beings to robustly outperform simple systematic processes likely holds true for investing, just as it holds true for most other fields.(1)
Much of the analysis conducted by value investors—reading financial statements, interpreting past trends, and assessing relative valuations—can be done faster, more effectively, and across a wider swath of securities via an automated process. Of course, gut-instinct value investors argue that experience adds value to the stock-selection process, but the evidence doesn’t support this interpretation. Why? One hypothesis is that discretionary investors respond to non-quantitative signals (e.g., the latest headlines on MSNBC, their expert friend’s opinion at the cocktail party, etc.), they unconsciously introduce cognitive biases into their investment process. These biases lead to predictable underperformance.
Alpha Architect performs quantitative value investing, and our Quantitative Value (QV) philosophy is meant to rectify this situation. The strategy is best suited for value investors who can acknowledge their own fallibility and embrace a systematic approach. Granted, our approach is not infallible, and differing viewpoints on value investing should always be questioned; however, the approach seeks to do the following:
Buy the cheapest, highest quality stocks in the market.
Note: For those who want to dive right into the specifics of the Quantitative Value Indexes, please visit our index website.
An Introduction to Our Quantitative Value Index
When we set out to develop our Quantitative Value (QV) approach we had one mission in mind:
- Identify the most effective way to capture the value premium.
Our mission involved three core beliefs:
- Value investing works, in part, because the strategy is high risk (higher risks generally lead to higher returns).
- Value investing works, in part, because of an overreaction to negative fundamentals that can lead to sentiment-driven mispricing.
- To extract the most benefits from the value premium, the portfolio needs to be focused (i.e., 50 stocks or less) and not a closet index.
After a decade of value investing research, rewrites, and regressions, our comprehensive findings on systematic value investing were published in the book, Quantitative Value in 2012.
The book has been well received by the investment community and we are confident that our objective to empower investors through education was achieved(2)
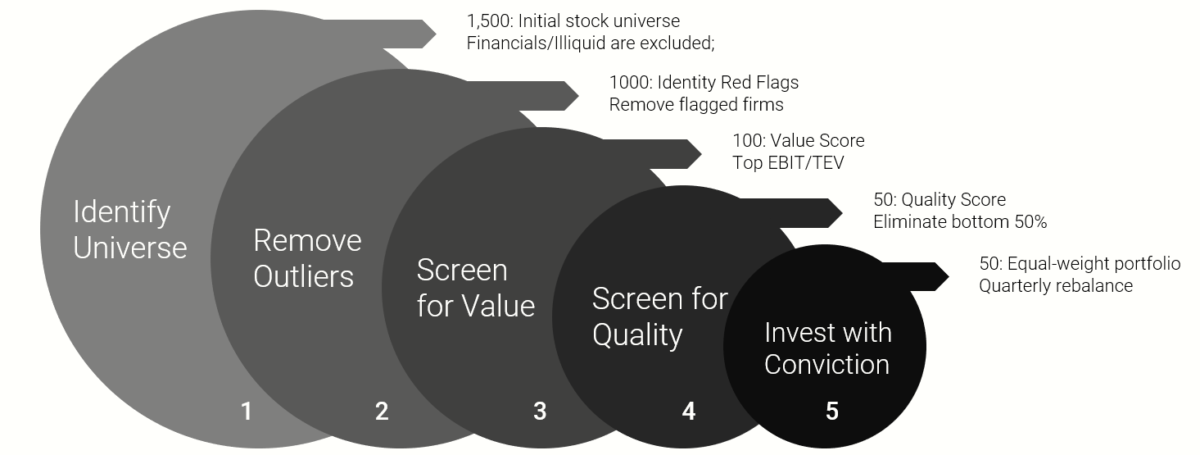
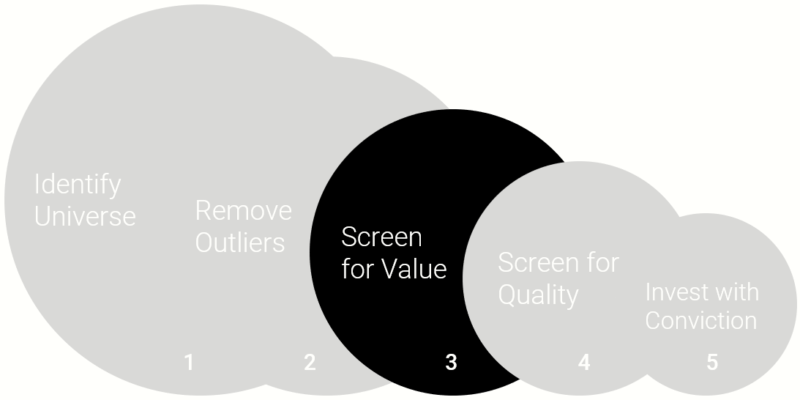
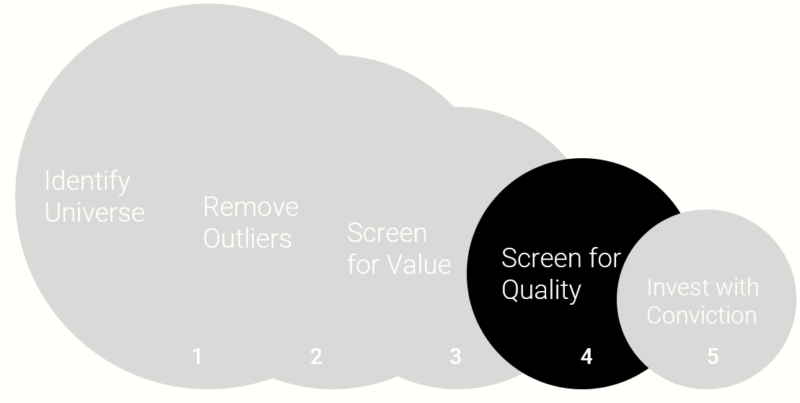
What resulted from our research is a reasonable, evidence-based approach to systematic value investing. Others agreed with us. In 2012, Alpha Architect partnered with a multi-billion dollar family office to turn our theoretical QV approach into reality. We spent several years building the operational infrastructure needed to ensure a smooth transition from academic theory to real-time performance. In the end, we distilled our entire process into an index that reflects five core steps (depicted in the figure below). We focus on the US version of the index in this piece, but we apply our technology in other markets as well.(3)
- Identify Universe: Our universe generally consists of the largest 1500 liquid U.S. exchange-traded stocks.
- Remove Outliers: We leverage algos derived from academic research to eliminate stocks with red flags.
- Screen for Value: We screen for stocks with the highest ratio of operating earnings to price. (Top 100 stocks)
- Screen for Quality: We rank the cheapest stocks on their current financial strength. (Top 50 stocks)
- Investment with Conviction: We seek to invest in a concentrated portfolio of the cheapest, highest quality value stocks. This form of investing requires disciplined commitment, as well as a willingness to deviate from standard benchmarks.
Step 1: Identify the Investable Universe
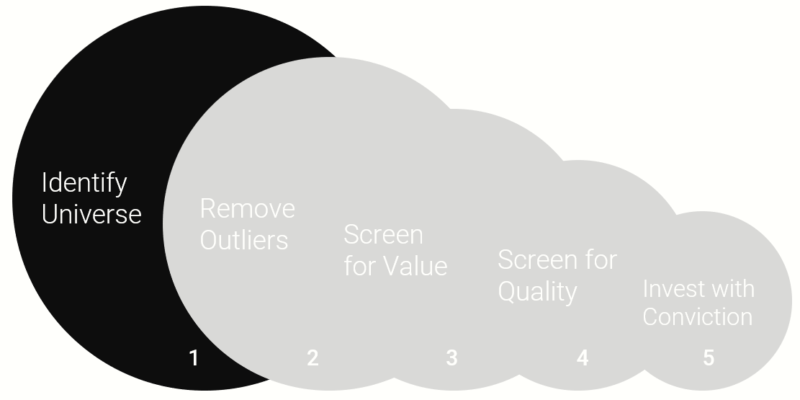
The first step in the Quantitative Value investing process involves setting boundaries on the universe for further screening. There are several reasons we place such limits around the stocks to consider. A critical aspect involves liquidity, which is related to the size of the stocks under consideration. In general, if we include stocks that are too small, the possibility of large price movements on small volume is a real risk. Ignoring liquidity leads to overstated backtests relative to actual returns. In other words, if we include small stocks in our universe, the back-tested results may generate phenomenal returns, but these returns are likely unobtainable in the real world, even when operating with small amounts of capital. (see replicating anomalies).
In order to honestly assess and implement the Quantitative Value investing approach, we focus on the largest 1,500 stocks in the universe and eliminate those with the bottom 15% on liquidity (e.g. Average daily volume, or ADV). Our universe also excludes ADRs, REITS, ETFs, CEFs, financial firms, and others that present various data challenges incompatible with the QV approach.(4)
In summary, our investment universe contains relatively liquid, smid-cap+, non-financial companies.
Step 2: Remove Outliers
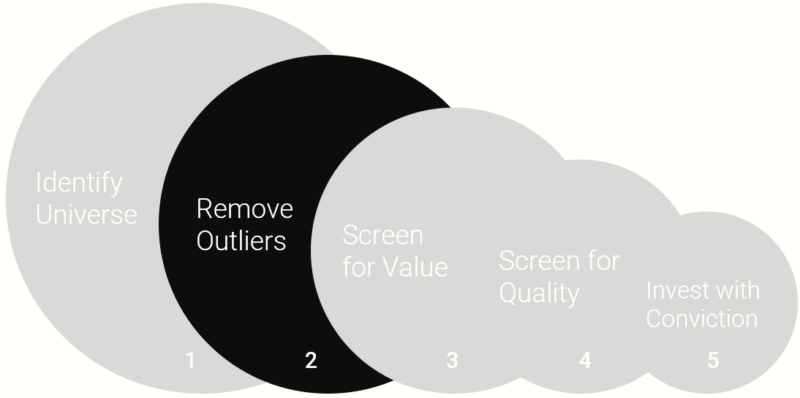
As noted value investor Seth Klarman has advised, “Loss avoidance must be the cornerstone of your investment philosophy.” This is an important concept and underlies the first phase of our approach. As an initial criterion for making a successful investment, we seek to eliminate those firms that risk causing permanent loss of capital.
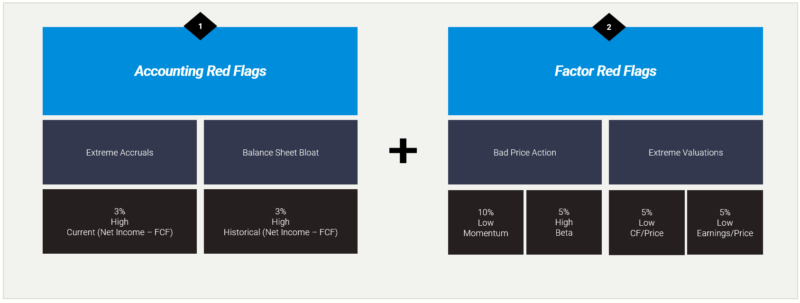
Permanent loss of capital can come in many forms, but we bucket these risks into two basic categories:
- Accounting red flags
- Factor red flags
The graphic below summarizes our approach:
Accounting Red Flags
Our first set of tools calculate measures related to accruals. Bernstein succinctly states the problem with accruals:(5)
CFO (cash flow from operations), as a measure of performance, is less subject to distortion than is the net income figure. This is so because the accrual system, which produces the income number, relies on accruals, deferrals, allocations and valuations, all of which involve higher degrees of subjectivity than what enters the determination of CFO. That is why analysts prefer to relate CFO to reported net income as a check on the quality of that income. Some analysts believe that the higher the ratio of CFO to net income, the higher the quality of that income. Put another way, a company with a high level of net income and a low cash flow may be using income recognition or expense accrual criteria that are suspect.
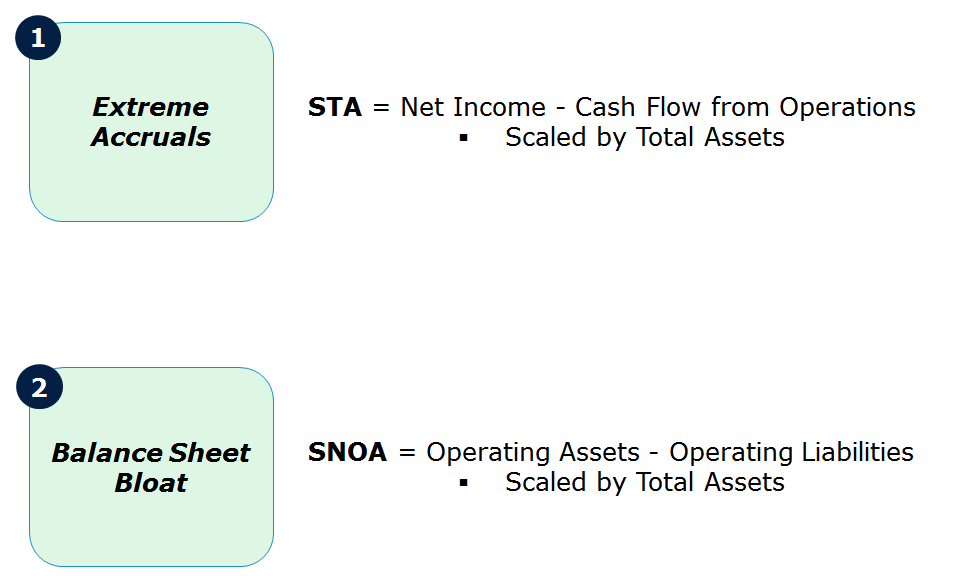
As Bernstein states, the problem with accruals is that they open the door for potential financial statement manipulation. A range of academic research has tested the hypothesis that investors fail to appreciate the importance of accrual measures and their impact on stock returns.(6) We have leveraged this research to develop our own forensic accounting tools that use various accrual metrics to identify potential manipulation and subsequently eliminate these firms from our investment set. We look at extreme accruals and balance sheet bloat to capture red flags that might be associated with accruals.
We specifically target the following measures:
- STA = (net income – cash flow from operations) / Total Assets (see Sloan 1996)
- SNOA = (Operating Assets – Operating Liabilities) / Total Assets (see Hirshleifer et al. 2004)
Factor Red Flags
Historically, we levered tools that involved complex statistical prediction techniques to remove outliers from our universe.(7)
And while these tools helped us achieve our objective, our continuous research has helped us develop more robust techniques that are easier to understand and implement. We have two sets of factor red flags: bad price action and extreme valuations.
We systematically eliminate firms that are in the bottom 10% of our universe on generic 2-12 momentum and those firms in our universe with the top 5% highest betas. We’ve determined that stock market price signals are arguably a much more effective prediction tool than even the fanciest machine learning techniques and algorithms. So we’ve ditched complexity in favor of tried and true factor signals that help us eliminate the worst of the worst.
In addition, we seek to eliminate firms that have extreme valuations (top 5%) on metrics that are similar, but different than our preferred valuation metric, EBIT/TEV (explained below). This negative screen is meant to eliminate situations where there could be odd capital structure and/or data issues that make a firm look cheap on one metric, but expensive on another.
Note: we do not focus on book-to-market as a value metric because we do not believe it serves as an effective measure of earnings power and is less applicable to firms with intangible assets.
Step 3: Value Screen
Step 1 and Step 2 help us identify a universe in which we have the confidence to conduct further analysis. As a simple rule of thumb, steps 1 & 2 might garner a 1,000 stock universe of publicly traded common stocks (US) that are liquid and haven’t tripped any obvious “red flags.” Our goal in step 3 is to identify the cheapest 100 stocks from our universe.
In Step 3, we screen for the cheapest stocks, or what we could call “value stocks.” Ben Graham long ago recognized the importance of paying a low price for stocks. Graham’s “value anomaly,” or the significant outperformance of low price-to-fundamental stocks relative to high price-to-fundamentals, is now well-established in the academic and practitioner communities alike. However, practitioners continually tinker with this conclusion in order to create a better mousetrap. Typically, these ad-hoc adjustments include measures such as low price-to-earnings, low price-to-book value, dividends, etc. Not a week goes by when we aren’t solicited with a hot, new metric to test against our approach. We sought to provide a comprehensive answer to this debate. In the Journal of Portfolio Management, we published a peer-reviewed assessment of the best valuation metric(s) available. Simply stated, which measure of value has historically worked the best?(8)
We reviewed historical stock market returns against a myriad of value strategies. More importantly, we directly tested them against one another in a quantitative horse race.
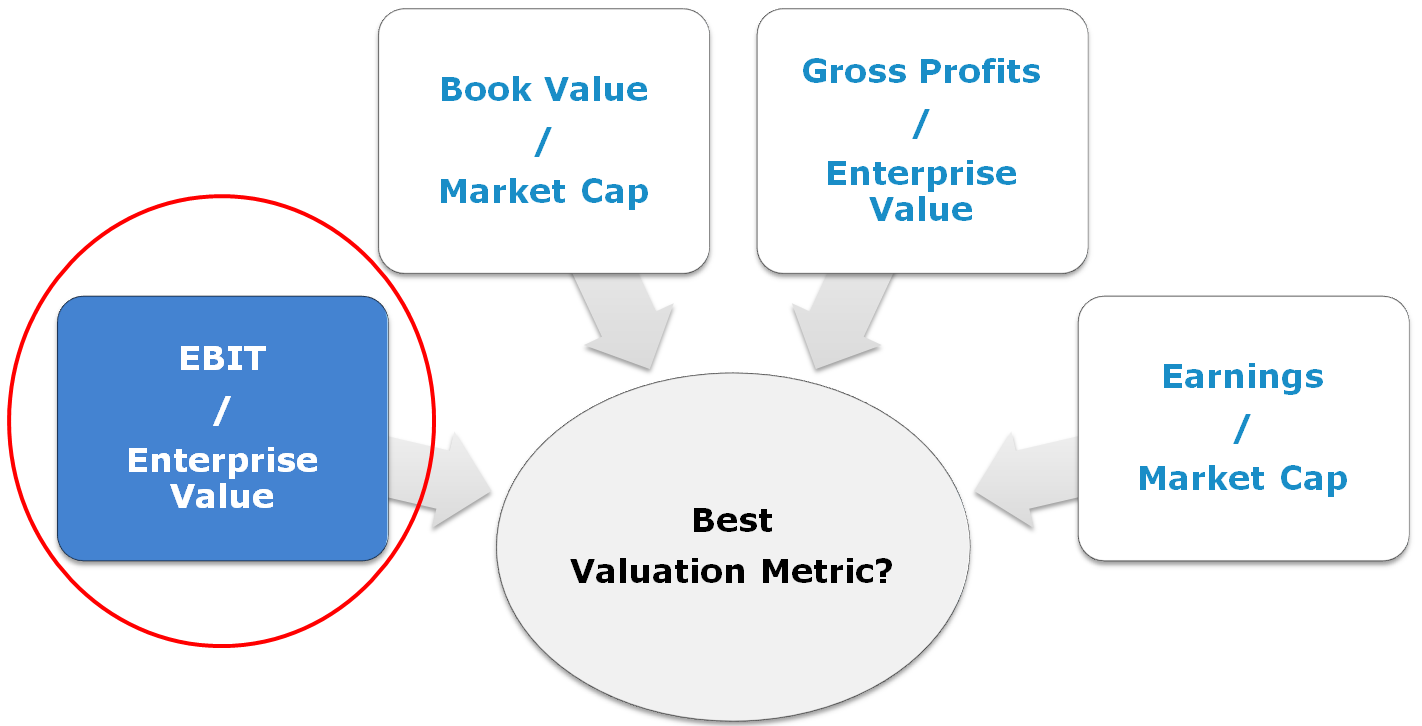
The “horses” in our race were the following valuation metrics:
- E/M – Earnings to Market Capitalization: The E/M ratio is simply a firm’s earnings divided by its total market capitalization.(9)
- EBITDA/TEV – Enterprise Multiple: Employed extensively in private equity, this is simply a firm’s earnings before interest, taxes, depreciation and amortization (EBITDA) divided by its total enterprise value (TEV).(10)
- FCF/TEV – Free Cash Flow Yield: The numerator for this metric is Free Cash Flow, which is net income + depreciation and amortization – working capital changes – capital expenditures. Once again, total enterprise value (TEV) is in the denominator.
- GP/TEV – Gross Profits Yield: Revenue – cost of goods sold in the numerator (GP), and total enterprise value (TEV)in the denominator.
- B/M – Book-to-Market: The book value of a firm divided by the firm’s market value (an academic favorite).
Our conclusion? Enterprise multiples seem to be an effective metric to capture the so-called value premium. But don’t take our word for it. Academic researchers tackling the same problem agree.
Loughran and Wellman (2009) make the following claim regarding enterprise multiples:
…the enterprise multiple is a strong determinant of stock returns…
Walkshäusl and Lobe (2015) conduct the analysis of enterprise multiples on international markets and conclude the following:
…return predictability is pronounced in developed and emerging markets…
Based on the evidence, it would appear that enterprise multiples are the best-performing price metric in terms of both raw returns as well as on a risk-adjusted basis.
Now, we aren’t necessarily wedded to enterprise multiples. In fact, all the valuation-based metrics beat the benchmark (and combinations of value metrics also work!); however, we are wedded to ideas that tie nicely to economic and valuation theory. Enterprise multiples are appealing because they represent the valuation metric that a private company buyer would use to assess an investment opportunity, in other words, “the business buyer metric.” As Benjamin Graham, the intellectual founder of the value investment philosophy, states in his classic text, The Intelligent Investor, “Investment is most intelligent when it is most businesslike.”(11) If you’d like a common-sense explanation for why we prefer this metric, please see “What’s the Story Behind EBIT/TEV?“
Why EBIT/TEV? Note: Deep Geeks Section
We have conducted our own formal investigation into why enterprise multiples may “work the best,” at least historically. Arguably, this is a more important research question than knowing what worked the best in the past.
Our research project asks if the performance of the EBIT/TEV value factor is attributable to risk or mispricing. We set up the following experiment:(12)
- Break the cheapest and most expensive EBIT/TEV portfolio into different buckets based on their predicted mispricing (using a variety of measures).
- We create two portfolios:
- High Predicted Mispricing: Long a portfolio of cheap high mispricing and expensive high mispricing
- Low Predicted Mispricing: Long a portfolio of cheap low mispricing and expensive low mispricing
If EBIT/TEV is a risk-based measure, the difference in the performance of the predicted “high mispricing” and “low mispricing” portfolios should be insignificant because mispricing doesn’t drive performance, risk does. However, if there is a difference in these two portfolios, the results suggest that mispricing arguably drives the premium.
Our research suggests that the Enterprise Multiple (EM) effect can be attributed to mispricing, and not due to higher systematic risk. Although we will not deny that higher risk likely plays some role in the higher expected returns. Here is a figure highlighting the core conclusion when it comes to the enterprise multiple effect:(13)

The results are hypothetical results and are NOT an indicator of future results and do NOT represent returns that any investor actually attained. Indexes are unmanaged, do not reflect management or trading fees, and one cannot invest directly in an index. Additional information regarding the construction of these results is available upon request.
To summarize, the enterprise multiple metric seems to capture a higher degree of systematic mispricing than the multiple’s cousins: book-to-market, earnings-to-market, and so forth.
In our Quantitative Value Investing index methodology, we use a variation on the enterprise multiple as part of our valuation screening technology (EBIT/TEV), and screen our universe from Step 1 and Step 2 down to the top 100 cheapest stocks based on EBIT/TEV. This screen ensures we are dealing with a subset of firms that are sitting in the “bargain bin” in our universe.
Step 4: Quality Screens
After “cleaning” our liquid universe (Step 2) and zeroing in on the “bargain bin” of the cheapest stocks (Step 3), we move onto Step 4 of our investment process. Step 4 helps us identify the final 50 stocks that will go into our model portfolio.
Step 4 addresses a simple concern:
How do we separate cheap stocks that may be cheap for a good reason (junk) from cheap stocks that are fundamentally mispriced (good value)?
Academic research highlights fundamental analysis (often referred to as “quality” metric analysis) can help differentiate among the winners and losers when sifting through the cheap stock bargain bin.
For example, Piotroski and So (2012), make the following statement:
…a simple financial statement analysis-based approach can identify mispricing embedded in the prices of value firms.
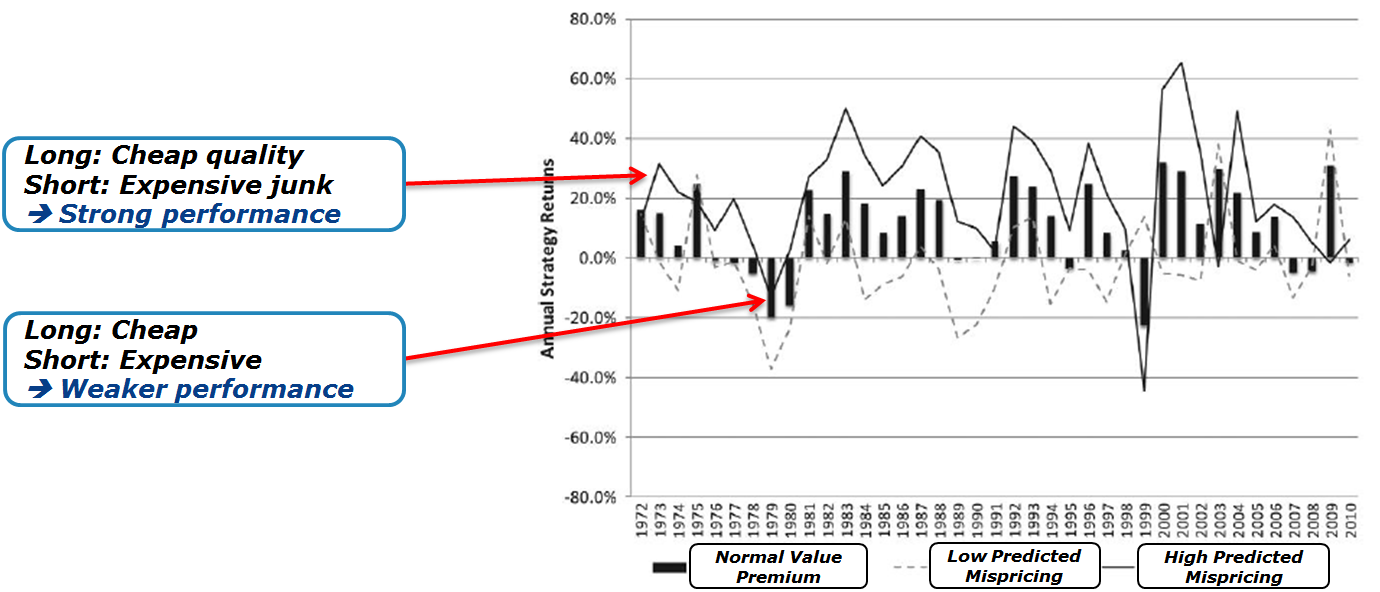
Here is an annotated figure from their research that highlights their key point:
The results are hypothetical results and are NOT an indicator of future results and do NOT represent returns that any investor actually attained. Indexes are unmanaged, do not reflect management or trading fees, and one cannot invest directly in an index. Additional information regarding the construction of these results is available upon request.
The black bars reflect a portfolio that captures the generic value premium: long cheap stuff; short expensive stuff. The solid black line represents the portfolio that is long cheap quality and short expensive junk; the dotted line is long cheap junk and short expensive quality. Under the risk-based explanation for the value premium, all three strategies should be roughly the same. However, the evidence suggests that fundamental analysis, or “quality” metrics, can help a value investor improve their results.
With this knowledge, we focus on our “financial strength score” to measure the quality of a firm to help us differentiate among the cheapest stocks we have identified in our universe.
Our Financial Strength Score (FS Score)
We introduce the notion of financial strength with an analogy. Suppose you had to sail across the Atlantic and were given a choice between making the crossing in either an eight-foot sailing dinghy tied together with rubber bands or Steve Ballmer’s yacht. Which would you choose? Obviously, you would want the safety and security afforded by the more seaworthy yacht. The same concept holds when deciding upon the stocks to include in your portfolio: all things being equal (which in this case means the stocks both reside in the “bargain bin”), an investor should seek out those cheap stocks that are less vulnerable to downturns or other macroeconomic shocks.
We know intuitively why a durable super yacht protects sailors better than a fragile dinghy: its heavy keel keeps it stable, it won’t roll violently in heavy winds, and it can take a pounding by waves. What are the financial characteristics that enable a firm to protect capital during a stormy business climate or from unanticipated developments? Several years ago, Joseph Piotroski, a specialist in accounting-based fundamental analysis, and currently a professor at Stanford did some interesting analysis relating to this subject. He used a nine-point scale, utilizing common accounting ratios and measurements, to evaluate the financial strength of companies and eliminated those most at risk of financial distress. This scale, which he called the “F_SCORE,” involved financial statement metrics across several areas: profitability, leverage, liquidity, and source of funds, and operating efficiency. The results were nothing short of astonishing: Piotroski found that a value investment strategy that bought expected winners and shorted expected losers generated a 23 percent annual return between 1976 and 1996—a record of which even Buffett would be proud. (14)
As Sir Isaac Newton noted, “If I have seen further, it is by standing on the shoulders of giants.” We also believe in standing on the shoulders of giants whenever possible since, as Newton observed, you can see so much farther. We, therefore, use Piotroski’s F-SCORE as a basis for our approach to measuring current financial strength, but with some improvements.
Here is a simple outline of our current financial strength 10-point checklist:
- Current profitability (3 items)
- Stability (3 items)
- Recent operational improvements (4 items)
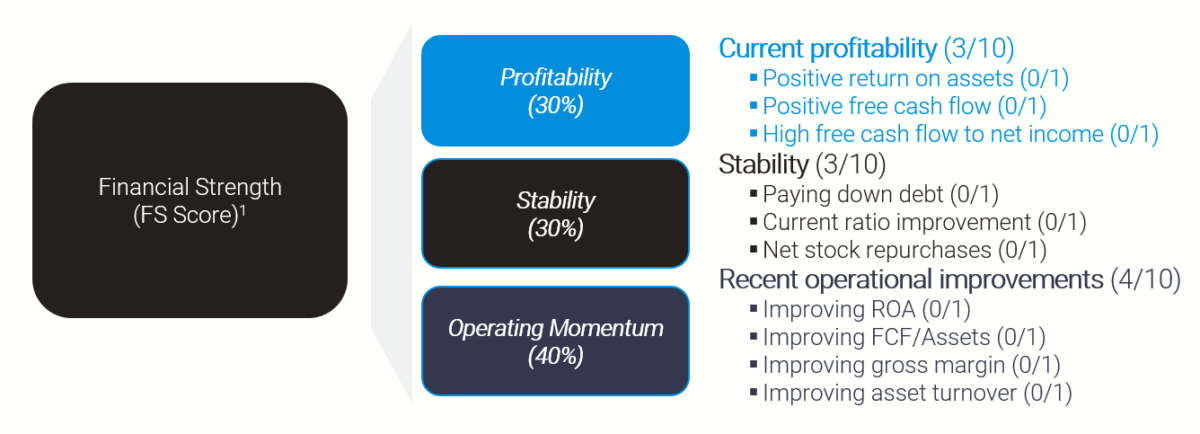
The current financial strength score reduces the overall financial health of a firm to a single number between 0 and 10, which can be used as a basis for comparing a firm’s overall financial strength versus that of other firms. Note: In the case of a tie we use the firm’s 2-12 momentum as the tie-breaker.
Finally, we sort our cheap 100 stock universe from step 3 on our composite quality score to identify a 50 stock universe of what we believe are the cheapest, highest-quality value firms.
Step 5: Invest with Conviction
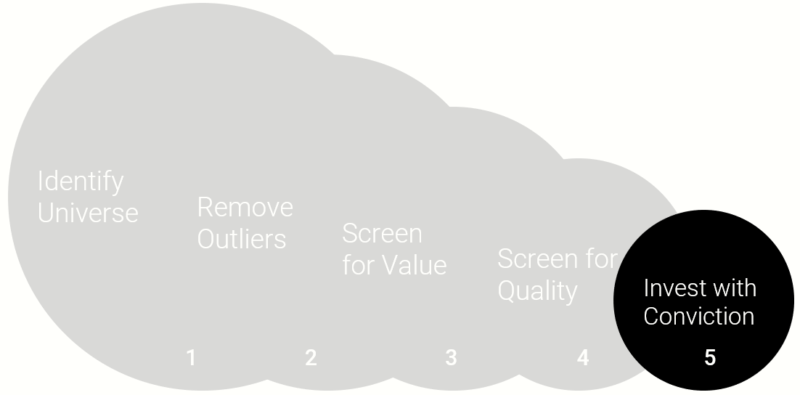
Steps 1 through 4 systematically seeks to identify the cheapest, highest quality value stocks using quantitative value investing. We believe that this portfolio of stocks has the highest probability of capturing the value premium over the long-term.
But one question remains: How do we construct our final Quantitative Value portfolio of investments?
Let us be clear upfront: we seek to avoid closet indexing.(15) Our goal is to build a differentiated portfolio that leans on our research and beliefs. We seek to build a portfolio that has favorable returns over a long horizon (i.e., 20+ years), but we also understand that this portfolio will likely come with large risks (i.e., the potential chance to underperform is also high).
Our philosophy on concentration is not unique. Charlie Munger, at the 2004 Berkshire Hathaway Annual Meeting, is quoted as saying:
The idea of excessive diversification is madness…almost all good investments will involve relatively low diversification.
Another word for Munger’s issue with diversification for a skilled manager is “diworsification.” Elton and Gruber, professors with multiple papers and books on the subject of diversification, highlight that the benefits to holding a bigger portfolio of securities decline rapidly after a portfolio grows beyond 50 securities.(16)
So while we are protected by diversification, we may not want too much if it dilutes our ability to achieve specific objectives. Jack’s post on portfolio construction talks directly to the Elton and Gruber findings in the context of value investing. Moreover, Charlie Munger is correct: to the extent, you believe you have a reliable method of constructing a high alpha “active” portfolio, less diversification is desirable.
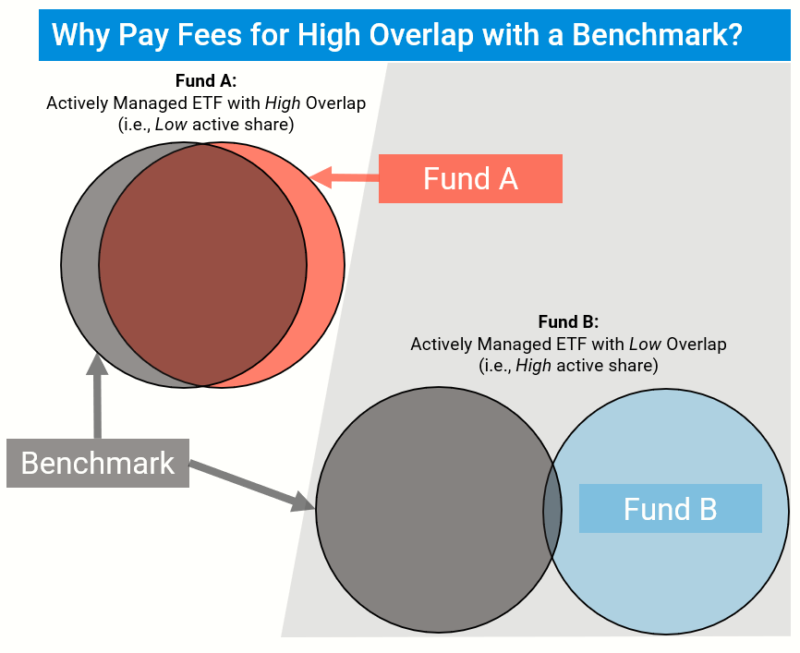
One way to formally measure this level of “activeness” is via active share, which essentially measures how much a portfolio overlaps with a given benchmark. Here is a post on how to calculate active share. And here are several pieces that discuss the topic more formally:
- K.J. Martijn Cremers & Quinn Curtis, Do Mutual Fund Investors Get What They Pay For? The Legal Consequences of Closet Index Funds
- “Mutual Fund Fees and Active Share” authored by the State of New York Attorney General. Accessed 12/23/2020.
In the end, we make no claims as to whether high or low active share can predict performance. But we agree with the message which highlights that one should only pay an extra fee for strategies that actually do something different than the benchmark (which typically costs almost nothing).
In the spirit of maintaining a high active share (aka “high conviction”), we construct our index to have around 50 securities. Consider a hypothetical illustration of our screening process, which roughly reflects our experience managing our index in the real-world:
- Identify Investable Universe: We typically generate 1500 names in this step of the process.
- Liquidity/Red Flag Screens: We usually end up with around 1000 stocks.
- Valuation Screens: Here we screen on the cheapest 100 stocks in the universe.
- Quality Screens: We calculate a composite quality score and eliminate the bottom half, leaving 50 stocks.
- Invest with Conviction: We invest in our basket of 50 stocks that are the cheapest, highest quality value stocks.
Our index has the following construction details:
- Equal-weight
- Quarterly rebalanced
- 20% industry constraint for the (1) U.S. and (2) International indices(17)
- No financials
- Pre-trade liquidity requirements
We don’t like to emphasize historical performance because we believe the process is paramount and who hasn’t seen a beautiful backtest?(18) But one can be sure that if they construct a portfolio with a high active share this portfolio will likely endure high tracking error and bounce around the benchmark (sometimes positively, but sometimes negatively). Unfortunately, we cannot build portfolios that “beat the market” on a consistent basis, but we do think we can build portfolios that can win over the long-haul.
Why Isn’t Everyone a Concentrated Systematic Value Investor?
We feel we have identified a reasonable systematic value investing approach that will capture a large value premium over time. Our approach is arguably far from perfect, but it works for our sensibilities and we are willing to invest our own capital in the concept. But while all of this may sound promising, one must consider a simple question:
If this is so easy why isn’t everyone doing it?
The easy answer is that most investors aren’t insane. We believe value investing works because it is risky and painful. There is no way around this basic fact. Investors who follow our index must buy stocks that probably make them uneasy, and almost all of our portfolio holdings have business problems that are lamented by the Wall Street Journal and CNBC day in and day out. Some of these problems will actually play out in the future and the index will lose money on these positions. However, on average, we believe these lamentations will never be as bad as initially advertised and the index will benefit, in the aggregate, when expectations revert to normal.
Nevertheless, the road will be bumpy, full of volatility, and is not for everyone.(19)
Conclusions Regarding the Quantitative Value Investing Process
In the short-run, most of us simply cannot endure the pain that value investing strategies impose on our portfolios and our minds. For those in the investment advisory business, providing a strategy with the potential for multi-year underperformance is akin to career suicide. (See here, here, and here for further explanation) And yet, at Alpha Architect, we explicitly focus on building our Quantitative Value Indexes based on our systematic value investing philosophy.
Clearly, these indexes are not for everyone. However, our hope is that we can educate investors with the appropriate temperament on what it takes to achieve long-term investment success as a value-investor. The single most important factor is sticking to a value investment philosophy through thick and thin. Our systematic value investment process facilitates our ability as investors to simply “follow the model” and avoid behavioral biases that can poison even the most professional and independent fundamental value investors.
We believe value investing works over the long-haul. Benjamin Graham distilled the secret of sound value investment into three words: “margin of safety.” We’ve focused on the behavioral aspects that drive value investing and taken Graham’s original motto a bit further.
Our enhanced process can be distilled into the following:
We seek to buy the cheapest, highest quality value stocks.
Wesley R. Gray and Jack R. Vogel, co-CIOs Alpha Architect
Detailed information on our Quantitative Value Indexes is available here.
References[+]
| ↑1 | Grove, W., Zald, D., Lebow, B., and B. Nelson, 2000, “Clinical Versus Mechanical Prediction: A Meta-Analysis,” Psychological Assessment 12, p. 19-30. | |||||||||||||||||||||||||||||||||||||||||||||||||||||||||||||||||||||||||||||||||||||||||||||||||||||||||||||||||||
|---|---|---|---|---|---|---|---|---|---|---|---|---|---|---|---|---|---|---|---|---|---|---|---|---|---|---|---|---|---|---|---|---|---|---|---|---|---|---|---|---|---|---|---|---|---|---|---|---|---|---|---|---|---|---|---|---|---|---|---|---|---|---|---|---|---|---|---|---|---|---|---|---|---|---|---|---|---|---|---|---|---|---|---|---|---|---|---|---|---|---|---|---|---|---|---|---|---|---|---|---|---|---|---|---|---|---|---|---|---|---|---|---|---|---|---|---|
| ↑2 | The recommendations are directed towards the quality of the book and are not an endorsement of advisory services provided by Alpha Architect, LLC or affiliates. Alpha Architect does not know if the recommenders approve or disapprove of its services. The recommendations were chosen from a list of formal recommendations based on if the author had a Ph.D. or not.
| |||||||||||||||||||||||||||||||||||||||||||||||||||||||||||||||||||||||||||||||||||||||||||||||||||||||||||||||||||
| ↑3 | All materials below have been updated as of 11/23/2020 to reflect the official updates to our indexes. | |||||||||||||||||||||||||||||||||||||||||||||||||||||||||||||||||||||||||||||||||||||||||||||||||||||||||||||||||||
| ↑4 | The elimination of financial firms is due to Step 3 and 4 of the Quantitative Value investing process, mainly due to the leverage of financial firms | |||||||||||||||||||||||||||||||||||||||||||||||||||||||||||||||||||||||||||||||||||||||||||||||||||||||||||||||||||
| ↑5 | Bernstein, L. 1993. Financial Statement Analysis. 5th ed. Homewood, IL: Irwin. | |||||||||||||||||||||||||||||||||||||||||||||||||||||||||||||||||||||||||||||||||||||||||||||||||||||||||||||||||||
| ↑6 | Examples include Sloan, 1996, “Do Stock Prices Fully Reflect Information in Accruals and Cash Flows about Future Earnings?” Accounting Review 71, p. 289-315 and Hirshleifer, Hou, Teoh, and Zhang, 2004, “Do Investors Overvalue Firms with Bloated Balance Sheets?” Journal of Accounting and Economics 38, p. 297-331. | |||||||||||||||||||||||||||||||||||||||||||||||||||||||||||||||||||||||||||||||||||||||||||||||||||||||||||||||||||
| ↑7 | Beneish, M. D, 1999, The detection of earnings manipulation, Financial Analysts Journal, 55(5), 24-36 and Campbell, Hilscher, Szilagyi, 2011, Predicting Financial Distress and the Performance of Distressed Stocks, Journal of Investment Management 9, p. 14-34.
| |||||||||||||||||||||||||||||||||||||||||||||||||||||||||||||||||||||||||||||||||||||||||||||||||||||||||||||||||||
| ↑8 | Jack Vogel and I have a formal paper on this subject, “Analyzing Valuation Measures: A Performance Horse Race over the Past 40 Years,” published in The Journal of Portfolio Management 39, p 112-121. | |||||||||||||||||||||||||||||||||||||||||||||||||||||||||||||||||||||||||||||||||||||||||||||||||||||||||||||||||||
| ↑9 | Note the E/M is the inverse of the more commonly referenced P/E ratio. | |||||||||||||||||||||||||||||||||||||||||||||||||||||||||||||||||||||||||||||||||||||||||||||||||||||||||||||||||||
| ↑10 | Total Enterprise Value (TEV) can be thought of as the price an outside buyer would need to pay to buy the entire firm — the buyer would need to buy all the equity and the debt, but would receive back any cash the company has on hand. Formally, we measure TEV as follows: TEV = Market Capitalization + Short-term Debt + Long-term Debt + Preferred Stock Value – Cash and Short-term Investments. | |||||||||||||||||||||||||||||||||||||||||||||||||||||||||||||||||||||||||||||||||||||||||||||||||||||||||||||||||||
| ↑11 | Graham, B. 1993. The Intelligent Investor. 4th Revised Edition. New York, NY: Harper & Row Publishers. | |||||||||||||||||||||||||||||||||||||||||||||||||||||||||||||||||||||||||||||||||||||||||||||||||||||||||||||||||||
| ↑12 | here is a summary of the paper | |||||||||||||||||||||||||||||||||||||||||||||||||||||||||||||||||||||||||||||||||||||||||||||||||||||||||||||||||||
| ↑13 | The image below is a visualization of the results from Table 2 of a working research paper by Crawford, Gray, Vogel, and Xu (accessed 6/1/17) | |||||||||||||||||||||||||||||||||||||||||||||||||||||||||||||||||||||||||||||||||||||||||||||||||||||||||||||||||||
| ↑14 | Piostroski, J., 2000, “Value Investing: The Use of Historical Financial Statement Information to Separate Winners from Losers,” Journal of Accounting Research 38, p. 1-41. | |||||||||||||||||||||||||||||||||||||||||||||||||||||||||||||||||||||||||||||||||||||||||||||||||||||||||||||||||||
| ↑15 | a term used to describe strategies that claim to actively purchase investments but wind up with a portfolio not much different from the benchmark. | |||||||||||||||||||||||||||||||||||||||||||||||||||||||||||||||||||||||||||||||||||||||||||||||||||||||||||||||||||
| ↑16 | Elton, E. and Martin Gruber, 1977, Risk Reduction and Portfolio Size: An Analytical Solution, The Journal of Business 50, p 415-437. | |||||||||||||||||||||||||||||||||||||||||||||||||||||||||||||||||||||||||||||||||||||||||||||||||||||||||||||||||||
| ↑17 | At the time of rebalancing, using NAICs 4-digit codes. 25% industry constraint for Canada. | |||||||||||||||||||||||||||||||||||||||||||||||||||||||||||||||||||||||||||||||||||||||||||||||||||||||||||||||||||
| ↑18 | However, if you’d like to see the hypothetical performance we suggest you review our index educational materials, which are available here. | |||||||||||||||||||||||||||||||||||||||||||||||||||||||||||||||||||||||||||||||||||||||||||||||||||||||||||||||||||
| ↑19 |
Consider the experience of a systematic value investor who simply buys low-priced stocks. Our approach, while not exactly the same as a simple low-price value strategy, shares many of the same characteristics—both good and bad—so this thought experiment serves as a nice case study to contextualize the costs and benefits of contrarian investment programs. Using data on portfolios sorted by book-to-market ratios, we examine time periods where it was painful to be a value investor. One such period is during the run-up to the internet bubble. We examine the gross total returns (including dividends and cash distributions) from 1/1/1994-12/31/1999 for a Value portfolio (High book-to-market decile, market-weighted returns, FF_VAL), and a Growth portfolio (Low book-to-market decile, market-weighted returns, FF_GROWTH), the S&P 500 total return index (SP500), and the 10-Year Treasury Total Return index (10-Year). Bloomberg and Ken French Website: http://mba.tuck.dartmouth.edu/pages/faculty/ken.french/data_library.html The figure below highlights the extreme underperformance of the simple value portfolio relative to a simple growth portfolio and the broader market. From 1994 to 1999, value underperformed growth by almost 7 percentage points a year. Now that’s a pain! When one compounds that spread over 5 years it translates into a serious spread in cumulative performance.
The results are hypothetical results and are NOT an indicator of future results and do NOT represent returns that any investor actually attained. Indexes are unmanaged, do not reflect management or trading fees, and one cannot invest directly in an index. Additional information regarding the construction of these results is available upon request. The figure below makes the point even more clear. The value strategy underperforms the broad market for 5 out of 6 years.
The results are hypothetical results and are NOT an indicator of future results and do NOT represent returns that any investor actually attained. Indexes are unmanaged, do not reflect management or trading fees, and one cannot invest directly in an index. Additional information regarding the construction of these results is available upon request. Would you retain your financial advisor if they underperformed for 6 years straight? Most would not. Even the most disciplined and hardened value investor would have a hard time staying disciplined to a philosophy that lost to the market for almost 6 years in a row. Warren Buffett, arguably the greatest investor of all-time, was criticized in the media for “losing his magic touch” at the tail-end of the late ‘90s bull market. Of course, looking back, we now realize that in 1999 the internet bubble was about to burst. Value investors got the last laugh over the next 6 years. From 2000 to 2006 value stocks earned 13.00 percent a year relative to the market’s paltry -4.57 percent/year performance. Here are the annuals:
The results are hypothetical results and are NOT an indicator of future results and do NOT represent returns that any investor actually attained. Indexes are unmanaged, do not reflect management or trading fees, and one cannot invest directly in an index. Additional information regarding the construction of these results is available upon request. Over the full cycle from 1994 to 2006, value came through: Value earned 16.03 percent a year, while the market earned 8.69 percent a year. An investor compounding at a 2.03 percent spread over the market return over nearly twenty years will generate a substantially different wealth profile over time. The figure below shows the performance of the simple low-price value strategy relative to the market from 1994 to 2006:  Since 2006, value has entered the pain trade. Now for a 10 year stretch (the figures below are from 2007 to 2016).
The results are hypothetical results and are NOT an indicator of future results and do NOT represent returns that any investor actually attained. Indexes are unmanaged, do not reflect management or trading fees, and one cannot invest directly in an index. Additional information regarding the construction of these results is available upon request. Will value ever come back? Who really knows. But history suggests that the value premium is often captured by those with the ability to take on the most pain. |
About the Author: Wesley Gray, PhD
—
Important Disclosures
For informational and educational purposes only and should not be construed as specific investment, accounting, legal, or tax advice. Certain information is deemed to be reliable, but its accuracy and completeness cannot be guaranteed. Third party information may become outdated or otherwise superseded without notice. Neither the Securities and Exchange Commission (SEC) nor any other federal or state agency has approved, determined the accuracy, or confirmed the adequacy of this article.
The views and opinions expressed herein are those of the author and do not necessarily reflect the views of Alpha Architect, its affiliates or its employees. Our full disclosures are available here. Definitions of common statistics used in our analysis are available here (towards the bottom).
Join thousands of other readers and subscribe to our blog.