Anyone who has spent time reading this blog has become familiar with research involving asset pricing anomalies that generate excess returns.
In particular, the academic literature has addressed the following:
- “size,” or a portfolio of small minus big stocks (SMB) (see here for background)
- “value,” or a portfolio of high minus low book-to-market stocks (HML) (tons of research on value investing)
- “momentum,” or a portfolio of up minus down momentum stocks (UMD) (tons of research on momentum investing)
A feature of much of this research is that it is all “backtested” and based on gross returns. However, in the real world, returns are never “gross” of fees. We need to pay management fees, market makers, custodians, and so forth–Munger’s “croupiers” are in full force. So when putting academic trading strategies into practice, investors can’t ignore implementation costs, which form practical barriers and limit arbitrage opportunities.
But just how important are transaction costs when it comes to exploiting academic anomalies?
Nobody really knew, until now.
(1)Frazzini, Israel, and Moskowitz have an incredible paper that tackles this issue head-on, by evaluating the net-of-cost returns of the well-known asset pricing anomalies mentioned above (size, value, and momentum), and in an older version of their paper, the authors also examine the short term reversal effect (we recommend readers read the old and the new side-by-side).
The authors seek to answer two interesting questions:
- Do these anomalies survive trading costs?
- At what equilibrium size would an anomaly’s returns be completely eaten up by transaction costs?
Why are Questions Regarding Trading Costs Even Important?
If the trading costs to exploit anomalies are extremely high, then one might expect to see these anomalies persist in the future. Anomalies will continually “trick” future investors into thinking they have found an opportunity. However, this “opportunity” is a facade because net of transaction costs there will be no excess profits.
On the other hand, if transaction costs aren’t a huge burden when trying to exploit academic anomalies, investors need to conduct additional research to ascertain a basic question: Why aren’t investors already exploiting these profitable investment strategies? (see our sustainable active framework for guidance on this fundamental question)
What are the Core Findings?
The authors find that size, value, momentum, and ST reversal anomalies all survive transactions costs, and the amount that can be invested in these strategies can be large (ST reversal is the exception). These results are in stark contrast to prior literature, which leans towards the suggestion that academic anomalies are not that scalable and transaction costs prevent them from being exploitable. In short, claiming that transaction costs destroy the viability of stock-selection strategies is not supported by the evidence.
Bottom line: We’ve been following the progress of this paper for a few years now. The paper has gone from “rock solid” to “absolutely fascinating.” I’m sure a top-tier academic journal will eventually publish the results because it is a rare situation when academic researchers are able to access a treasure trove of new data, run the analysis, and then say, “Everything you previously thought was wrong.” That said, claiming that one can invest 100’s of billions into anomalies is still a stretch.
The Data for this Trading Costs Study
When it comes to trading costs, most investors (typically retail investors) think of explicit costs like the bid-ask spread and commissions. However, in the real world, a huge driver for trading costs is the price impact, especially for larger investors. For example, if I try to buy $1mm worth of stock in a single day when the average daily value traded in $100,000, it is likely that my order will have a major impact on the price. The 1 penny commission and 1.00% bid/ask spread won’t matter when I execute most of my order at a 20 percent premium to the current market price!
Of course, the problem with estimating price impact is getting access to live trading data. Fortunately, the authors access a unique dataset of over a trillion dollars of live trades from a large institutional money manager (we’re guessing they had help from AQR, call it a hunch). The execution data is available for over 1.7 trillion dollars in trade value covering nearly 10,000 stocks between 1998 and 2013. This institutional manager examined serves as the theoretical “arbitrageur” that seeks to exploit the so-called anomalies documented in the academic literature. In fact, the manager examined implements strategies that try and exploit the common academic anomalies (e.g., size, value, momentum).
The authors believe that this sample of live trading data can accurately capture the marginal investor’s trading costs with regard to these strategies.
Do the Anomalies Survive Trading Costs?
The authors describe the methodology for calculating trading costs in this paper. They reconstruct long-short anomaly portfolios following the techniques documented in the literature (e.g., SMB, HML, UMD, etc.) and apply trading costs to these portfolios based on their live trading data.
An example discussed in the paper:
For example, if the UMD portfolio required buying Microsoft on June 30, 2003, we assume that the market impact of that purchase is equal to the average market impact of Microsoft trades between January 1, 2003, and June 30, 2003.
Using the author’s technique, the trading costs associated with the anomaly portfolios are based on realized trading outcomes and require no modeling or estimation techniques. In other words, the frictional costs assumed are the frictional costs one would have approximately realized as a large institutional investor.
Note, that although the authors replicated SMB, HML and UMD using stocks for which trading data is available, the dataset covers about 63% of the portfolio weights of these strategies (34% internationally). The correlation of the replicated portfolios with those from Ken French library are extremely high (0.96 for HML, 0.97 for UMB, and 0.78 for SMB).
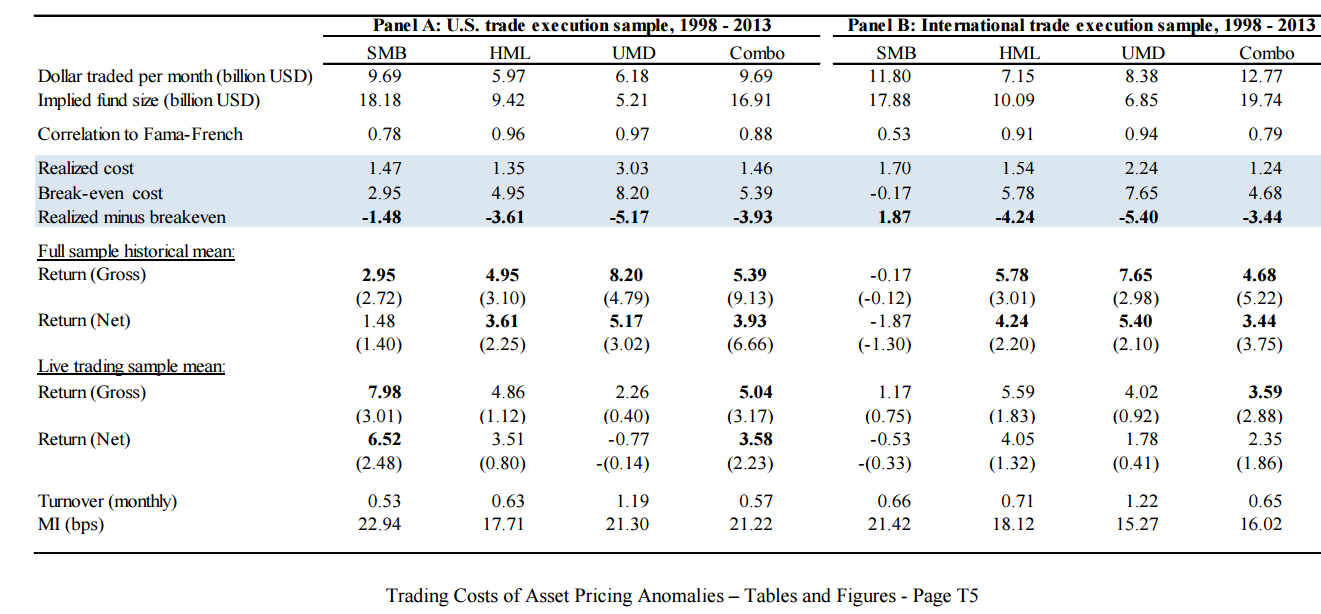
The table below shows the summary stats over the sample of live trading data (from the older paper, which includes ST reversal):

One can read the results in table 5 as follows (quote from paper):
For UMD [long/short momentum], the net expected return at its implied fund size of $3.7 billion is 4.34 percent per year (t-statistic of 8.42) and its break-even fund size is $52 billion.
The realized net of fee premiums for the various anomalies are large and can be deployed on sizable amounts of capital. However, the results do not suggest that exploiting these anomalies is easy (e.g., career risk), but they certainly suggest that transaction costs cannot evaporate the documented results.
Here is the same table from the updated paper–no major changes:
The results are truly remarkable and can be used to answer pragmatic questions. For example, Jack highlights in two recent posts how portfolio construction (i.e., concentration and turnover) affects performance for both value and momentum. He shows that portfolio construction can have dramatic effects on expected performance. However, the results presented in his research are “gross of fees” and it was left up to the reader to determine how transaction costs might influence the net results. With the insights from this new paper, one can combine the results from Jack’s analysis to determine a “sweet spot” for the type of value or momentum fund one wants to create and/or invest in.(2)
Trading Costs Matter, but Popular Factors Have Some Capacity
Transaction costs are commonly discussed as a core reason why anomalies–especially momentum–are failed investment practices left to the hypothetical day trading technical analysis heretics who lack brains. And while the academic research consensus is that transaction costs matter for anomaly strategies, as they do for any active investment strategy, the myth that academic anomaly strategies are too expensive to exploit is probably too strong. This “myth” is often preached by those who are (1) unfamiliar with the research on the subject and/or (2) have never had experience trading these strategies in practice. As Cliff Asness states in his Facts, Fiction and Momentum Investing paper:
You don’t have to do much math to realize that momentum can easily survive trading costs.
We encourage interested readers to explore and compare the analysis of transaction costs presented in this paper with other papers. For further discussion on this subject, there is a paper by Lesmond, Schill, and Zhou in 2004, which claims that momentum profits are illusory based on ad-hoc assumptions regarding trading costs. Korajczyk and Sadka also examine the issue, but consider market impact costs. These authors estimate that momentum strategies have limited capacity, estimated at roughly $5 billion. An additional transaction cost analysis is a paper in 2015 by Fisher, Shah, and Titman that uses the estimated bid/ask spreads from 2000-2013 to assess the trading costs associated with momentum strategies. Their conclusions are that their “estimates of trading costs . . . are generally much larger than those reported in Frazzini, Israel, and Moskowitz, and somewhat smaller than those described in Lesmond, Schill, and Zhou and Korajczyk and Sadka.”
Academic Estimates Versus Real-World Trading Cost Estimates
The analysis below arguably drives a stake in the heart of the analysis from academic researchers.
A chart from the paper under discussion highlights the difference in capacity estimates ($5B vs. $50B+) between “academic models of transaction costs” and “real-world transaction costs.” (KS = Korajczyk and Sadka).

Perhaps the most telling chart from a version of the paper is when the authors compare the implied costs of transacting in the broad market portfolio using “academic models” versus using live trading data.
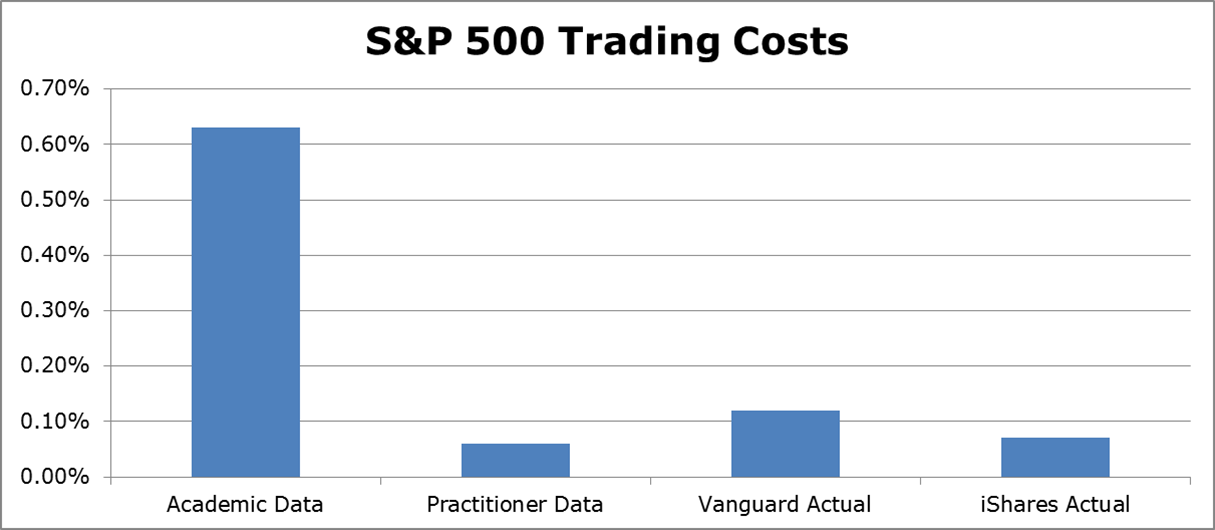
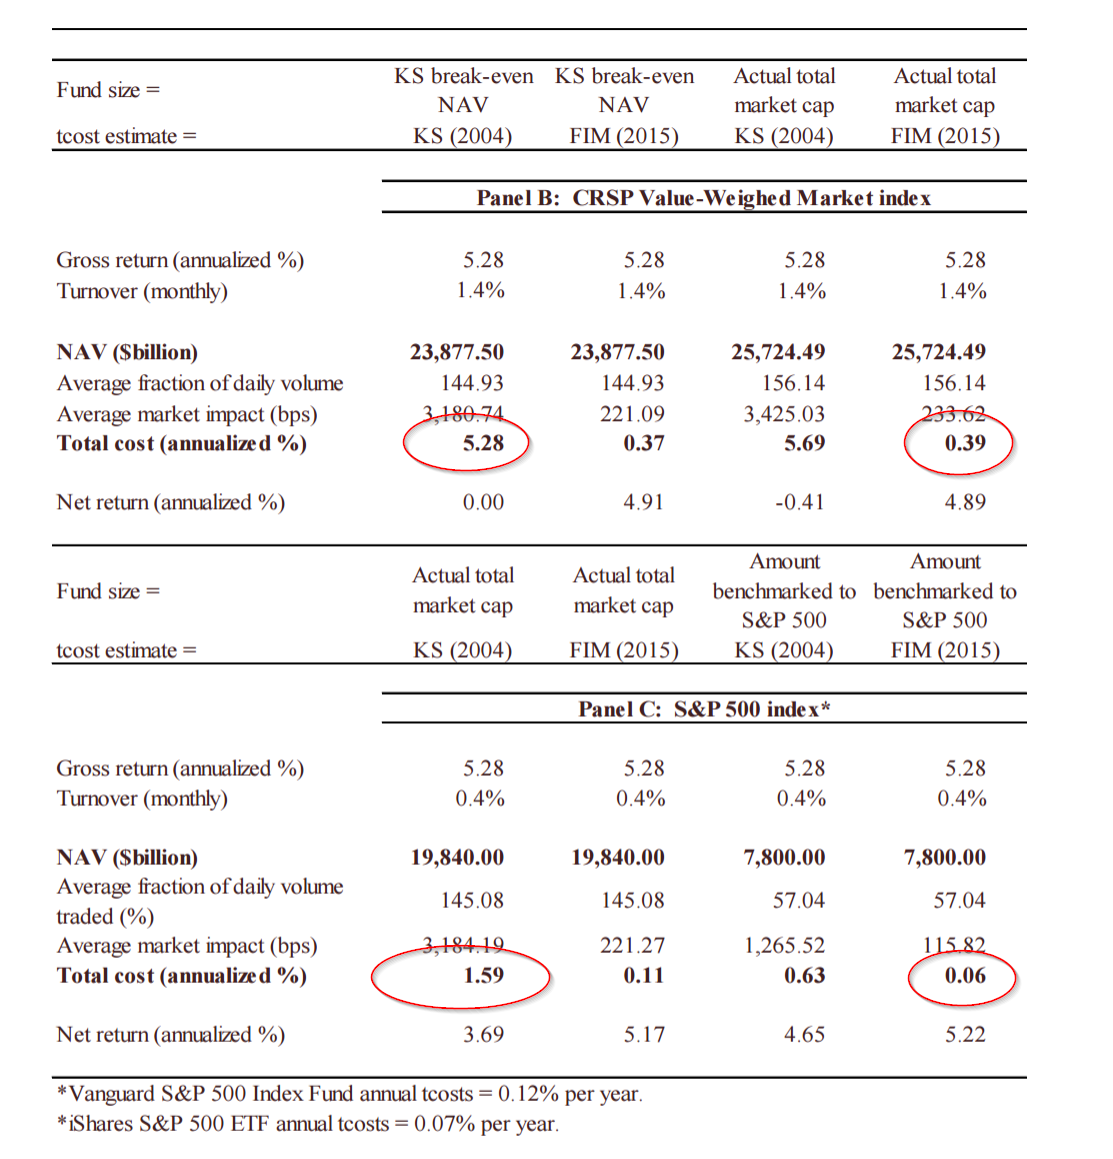
Using the technique of KS, the implied annual cost to simply trading in the CRSP VW index or the S&P 500 index is 5.28% and 1.39%, respectively. Whereas using the technique explored in this paper the estimates are 39bps and 6bps, respectively. Clearly, Vanguard isn’t eating 1.39% a year in transaction costs to maintain their S&P 500 exposure — it is much closer to 6bps. The source data for the table is presented below:
In short, the academics probably have this one wrong. So while the debate over transaction costs is heated, the consensus from the research seems to be that anomalies exist net of transaction costs, but the scalability is limited. We’ll have to ask Gary Antonacci how to explain this one.
We welcome your feedback and comments.
Trading Costs of Asset Pricing Anomalies
- Frazzini, Israel, and Moskowitz
- A version of the paper can be found here.
- Want a summary of academic papers with alpha? Check out our Academic Research Recap Category.
Abstract:
Using 1.7 trillion dollars of live trade execution data from a large institutional money manager across 21 developed equity markets over a 19-year period, we measure the real-world trading costs and price impact function of a large trader. We provide a novel description of how costs vary across trade type, stock characteristics, trade size, time, and exchanges globally to test various theories of price impact. We find actual trading costs to be an order of magnitude smaller than previous studies suggest, and describe the tradingprocess leading to these costs. A model calibrated to match the distribution of actual costs across trade size, stocks, and time outperforms other models from the literature in out of sample tests that attempt to describe independent costs from brokers and realized costs of traded index funds. Our model based on realized costsfrom live trades portrays very different implementation costs than previous studies suggest.
References[+]
| ↑1 | Here is a recent Blackrock study that is similar in spirit to the study under investigation. |
|---|---|
| ↑2 | Sidenote: The “realized minus breakeven” is also based on the longer-term historical average premiums. Why does this matter? Consider the following example: using only in-sample data (1998 to 2011) the net of costs premium to SMB is 7.12% per year! However, using the historical average SMB premium the net benefit is 1.16% per year. On the flip side is momentum, with an in-sample net premium of negative 0.95% per year, but using the historical average premium, net momentum amounts to 4.34% per year. So determining the “net of cost” benefits of an anomaly critically depends on what one assumes to be the average long-term premia associated with a given factor/anomaly. |
About the Author: Wesley Gray, PhD
—
Important Disclosures
For informational and educational purposes only and should not be construed as specific investment, accounting, legal, or tax advice. Certain information is deemed to be reliable, but its accuracy and completeness cannot be guaranteed. Third party information may become outdated or otherwise superseded without notice. Neither the Securities and Exchange Commission (SEC) nor any other federal or state agency has approved, determined the accuracy, or confirmed the adequacy of this article.
The views and opinions expressed herein are those of the author and do not necessarily reflect the views of Alpha Architect, its affiliates or its employees. Our full disclosures are available here. Definitions of common statistics used in our analysis are available here (towards the bottom).
Join thousands of other readers and subscribe to our blog.